| Columns Retired Columns & Blogs |
Mark Levinson No.35 D/A processor Measurements
Sidebar 3: Measurements
The Mark Levinson No.35 has outputs of 2.067V (L) and 2.069V (R), unbalanced, when decoding a 1kHz, 0dB (full-scale) sinewave. The corresponding balanced output levels are 4.134V (L) and 4.139V (R). The latter is exactly the expected 6dB increase over the unbalanced mode. The output impedance was very low, measuring 6.5 ohms in the unbalanced mode (using the voltage-drop method). This is effectively to the specification, within the margin of error. As a result, the No.35 will have no problem driving long or capacitative cables. It should also work well with a passive control unit.
The Levinson was non-inverting from the unbalanced outputs, with a positive-going impulse test signal reproduced as positive at its outputs. (The balanced output is configured with pin 2 positive.) DC offset was 0.1mV in the left channel, but a somewhat higher than expected 26.2mV in the right, unbalanced. Checking the offset at the balanced outputs, I found that only the positive-to-neutral DC offset voltage in the right channel measured 26.2mV; the other three hot-to-neutral DC offsets all measured 0.3mV or less.
The No.35's frequency response was very flat, with less than a 0.25dB drop at 20kHz in balanced or unbalanced mode—and virtually identical in both. (Note that the balanced measurements were taken with an AES/EBU coaxial input and balanced outputs, the unbalanced measurements with an S/PDIF (RCA-type) input and RCA coaxial outputs.) The unbalanced mode frequency response is shown in fig.1. The de-emphasis error is shown on the same figure, displaced by 2dB for clarity. While only a small percentage of CDs are made with pre-emphasis, they will play back—for all practical purposes—with unaltered frequency response on the No.35.
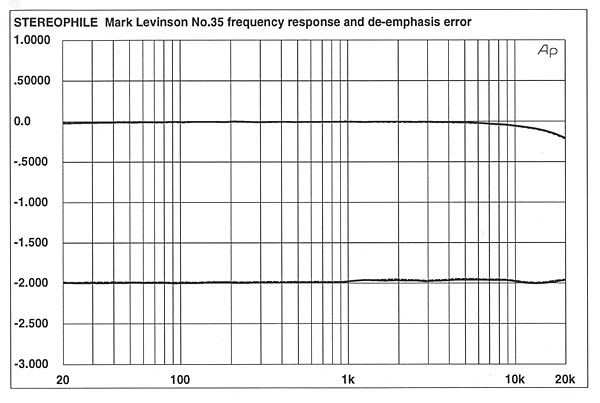
Fig.1 Mark Levinson No.35, frequency response (top) and de-emphasis error (bottom) at –12dBFS into 100k ohms (right channel dashed; 0.5dB/vertical div.)
The crosstalk shown in fig.2 is phenomenally low in balanced or unbalanced mode. The balanced result is slightly better, but the differences are rather academic. The only anomaly here is the sharp increase in crosstalk at 100Hz (power-supply noise?)—which nevertheless still remains better than –100dB.
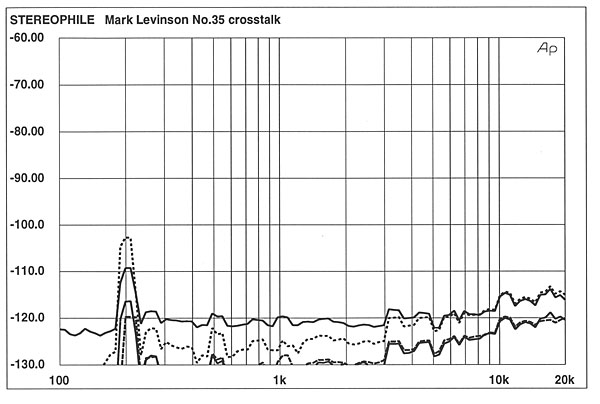
Fig.2 Mark Levinson No.35, channel separation (from bottom to top): L–R, R–L (dashed), balanced; L–R, R–L (dashed), unbalanced (10dB/vertical div.)
Fig.3 shows the audio-band spectrum of a decoded –90dB, 1kHz dithered sinewave signal. Both the balanced and unbalanced results are shown; they only diverge above the minor blip (the only real artifact present) at just under 2kHz. The unbalanced curve—the lower trace above that frequency—is virtually flat from 2kHz out to 20kHz. The latter is extremely rare; the slight rise seen in the unbalanced curve is far more common. Even for the unbalanced curve, however, this result is excellent. Using the same type of spectral analysis out to 200kHz, fig.4 shows the result of the Levinson's decoding of "digital silence" (all data words zero) in the balanced mode. The noise floor is astonishingly low in level—note the 20dB-lower vertical scale adopted for this plot, necessary to show the low-frequency difference between the two channels. This plot indicates close-to-20-bit resolution.
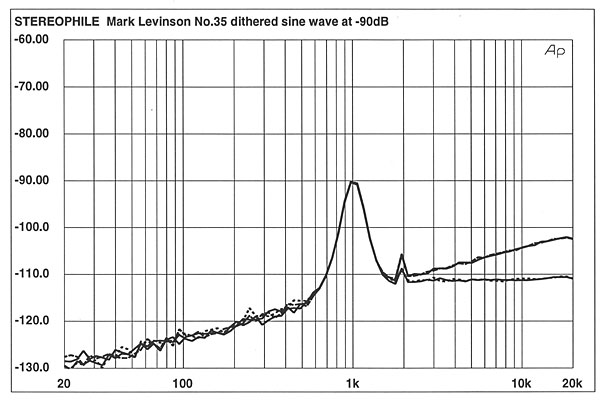
Fig.3 Mark Levinson No.35, 1/3-octave spectrum with noise and spuriae of dithered 1kHz tone at –90dBFS, with 16-bit data. Balanced outputs have lower noise above 1kHz. (Right channel dashed.)
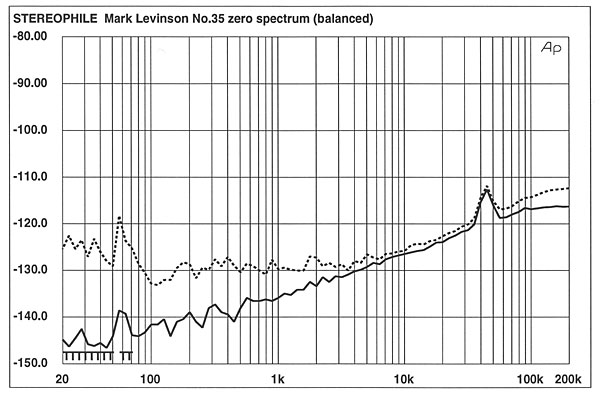
Fig.4 Mark Levinson No.35, 1/3-octave spectrum with noise and spuriae of digital black. Balanced outputs have lower noise above 1kHz. (Right channel dashed.) Note very low noise level.
Fig.5 shows the fade-to-noise with dither, again indicating outstanding linearity down to well below –100dB. Only the unbalanced mode result is shown; the balanced result is slightly better, with deviations of only +0.1dB in the right channel and +0.3dB in the left at –100dB. At –120dB, the balanced and unbalanced results differ by no more than about 0.8dB.
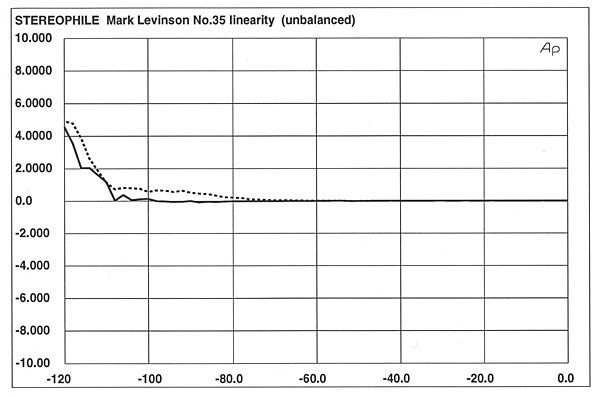
Fig.5 Mark Levinson No.35, unbalanced outputs, linearity error, 16-bit data (2dB/vertical div., dBr /vs/ dBFS).
Fig.6 shows the results of the Levinson decoding a 1kHz, undithered sinewave at –90dB in the unbalanced mode. This is a fairly good result; though somewhat obscured by noise, the desired stairstep response is just visible. Most CD playback devices do poorly on this test; of the players and processors I've tested, only the Sony X779ES (reviewed in Vol.16 No.6) comes to mind as giving a clearly superior rendition of the ideal stairstep response. (The unbalanced-mode result shown was actually slightly better than the balanced result.)
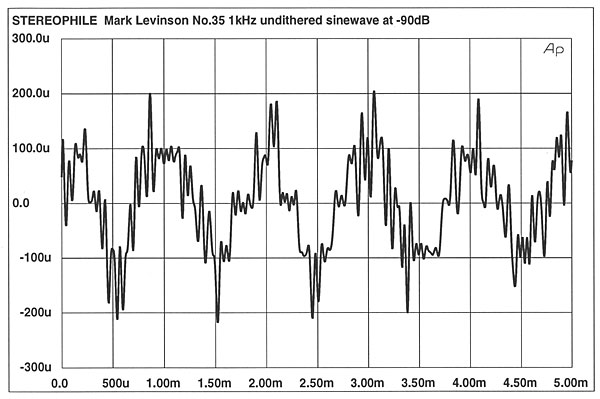
Fig.6 Mark Levinson No.35, waveform of undithered 1kHz sinewave at –90.31dBFS, 16-bit data (left channel blue, right red).
The noise modulation as a function of signal level vs frequency is plotted in fig.7. The results shown here are for six different, progressively decreasing signal levels, from –50dB to –100dB. The more tightly clustered the results, the better. Though the absolute noise level is slightly higher above 2kHz in the unbalanced mode, both balanced and unbalanced modes show an incredibly tight clustering. It would be hard to imagine a superior result short of a perfect overlay.
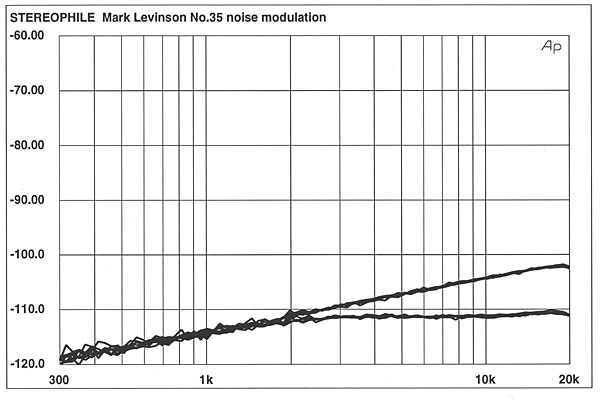
Fig.7 Mark Levinson No.35, noise modulation, –60 to –100dBFS (10dB/vertical div.). Balanced outputs have lower modulation noise above 2kHz.
Using a full-scale (0dB) 1kHz squarewave to drive the Levinson, we get the result shown in fig.8. This result is quite typical of players using linear-phase digital filters, but with visible clipping of the "ringing" observable on the top and bottom of the trace.
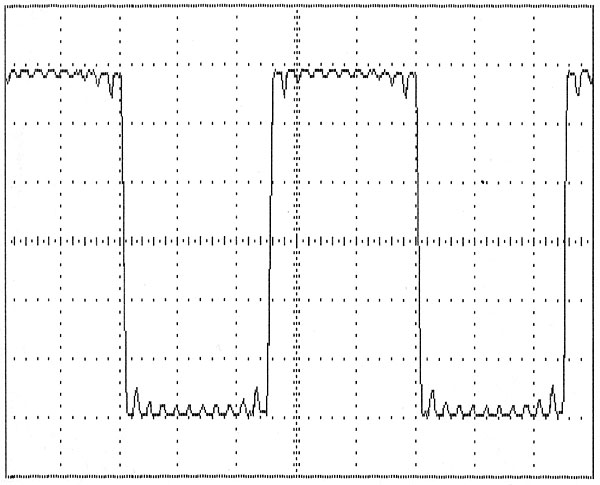
Fig.8 Mark Levinson No.35, 1kHz squarewave at 0dBFS.
Feeding a full-scale combined 19kHz+20kHz signal into the Levinson and performing an FFT analysis of the output results in the plot shown in fig.9. The artifacts are very low in level, with the highest—at 18 and 21kHz—more than 90dB down (less than 0.003% IM).
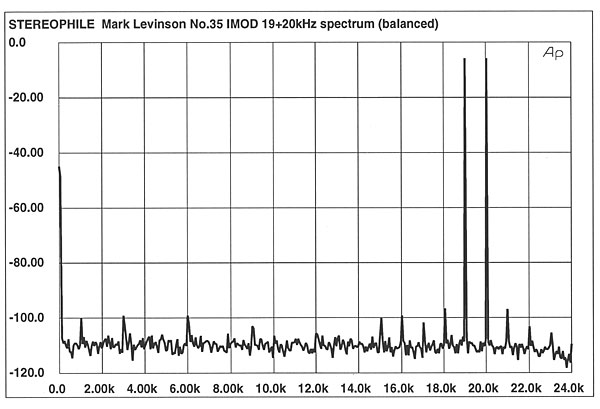
Fig.9 Mark Levinson No.35, HF intermodulation spectrum, DC–24kHz, 19+20kHz at 0dBFS into 100k ohms (linear frequency scale).
Using the Meitner LIM Detector to assess the No.35's jitter performance, FFTs of the LIM Detector output are shown in figs.10 (full-scale, 1kHz sinewave input signal to the No.35) and 11 (–90dBFS input). (Source was the CBS CD-1 test disc played on the Levinson No.31 transport with an S/PDIF link to the No.35.) The results are good, though we have measured lower jitter on less expensive processors. The same is true of the RMS jitter values: 212.6ps at 0dB, 317ps at –90dB.
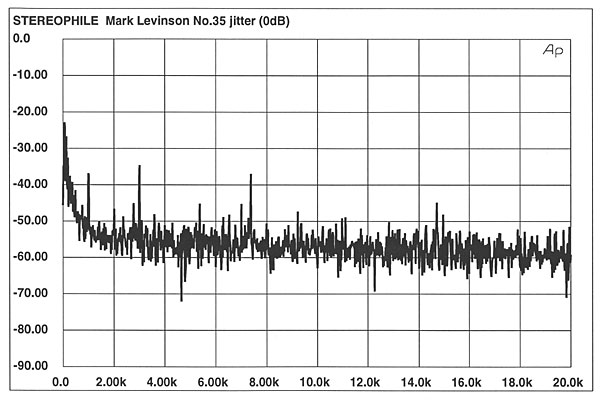
Fig.10 Mark Levinson No.35, word-clock jitter spectrum, DC–20kHz, while processing 1kHz sinewave at 0dBFS (linear frequency scale, 10dB/vertical div., 0dB = 1ns).
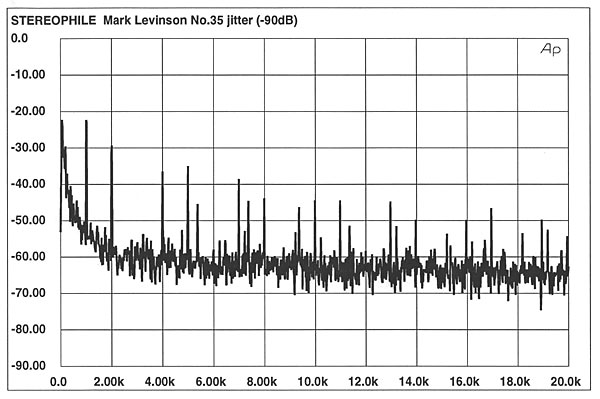
Fig.11 Mark Levinson No.35, word-clock jitter spectrum, DC–20kHz, while processing 1kHz sinewave at –90dBFS (linear frequency scale, 10dB/vertical div., 0dB = 1ns).
The excellent overall measured performance of the No.35 was no surprise. Occasionally, a player or processor with only fair measurements will sound superior. At times, a player measuring first-rate won't sound that way. With the No.35, there is no such dichotomy.—Thomas J. Norton
|
| ||||||||||
- Log in or register to post comments


| Loudspeakers Amplification Digital Sources | Analog Sources Accessories Featured | Music Columns Retired Columns | Show Reports | Features Latest News Community | Resources Subscriptions |
 © 2024 Stereophile
AVTech Media Americas Inc., USA
All rights reserved

