| Columns Retired Columns & Blogs |
Luxman M-800A power amplifier Measurements
Sidebar 3: Measurements
Footnote 1: Although it doesn't say so in the M-800A's literature, I suspect that this is the maximum power the amplifier will deliver in full class-A. At higher powers, the output stage progressively transitions into class-B operation until the amplifier eventually reaches its output voltage limit.
To examine the Luxman's measured behavior, I mainly used Stereophile's loaner sample of the top-of-the-line Audio Precision SYS2722 system (see www.stereophile.com/asweseeit/108awsi and www.ap.com).
Before performing tests on an amplifier, I thermally stress it by running it for 60 minutes at one-third the specified power into 8 ohms, which is the worst case for an amplifier with a class-B or -AB output stage. With its class-A output stage, the Luxman easily survived this ordeal; at the end of the hour its chassis was warm, but not so hot that I couldn't keep my hand on it. In that time the THD+noise had risen from 0.007% to 0.0089%.
The M-800A's voltage gain into 8 ohms was 28.8dB for the balanced and unbalanced inputs. The unbalanced input preserved absolute polarity (ie, was non-inverting), while the balanced input inverted polarity, due to the XLR jack being wired with pin 3 hot and pin 2 cold, the opposite of the AES standard. At 43k ohms, the unbalanced input impedance was insignificantly lower than specified at low and midrange frequencies, though this did drop slightly at 20kHz, to 32k ohms. The balanced input impedance was to specification at 67k ohms at all frequencies.
The Luxman's output impedance was a little higher than usual for a solid-state design, at 0.12 ohm at low and midrange frequencies, rising to 0.16 ohm at the top of the audioband. Even so, any modulation of the amplifier's frequency response due to the Ohm's Law interaction between its output impedance and the modulus of our simulated loudspeaker's impedance remained within ±0.1dB (fig.1, green trace). This graph also shows that the amplifier's bandwidth changes only slightly with load impedance, the –3dB point lying at 80kHz into 8 ohms (blue, red), and at 60kHz into 2 ohms (gray). This was for the balanced input; the unbalanced input had a wider bandwidth, the response into 8 ohms lying at 120kHz (not shown). The Luxman's reproduction of a balanced 10kHz squarewave had slightly slowed leading edges (fig.2), though there is no sign of overshoot or ringing.
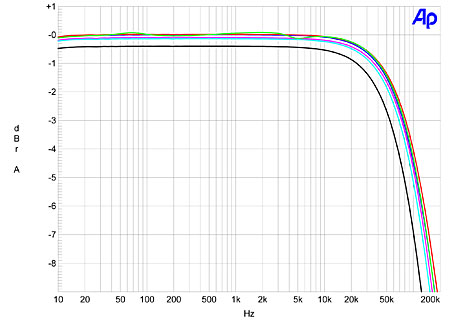
Fig.1 Luxman M-800A, frequency response at 2.83V into: simulated loudspeaker load (green), 8 ohms (left channel blue, right red), 4 ohms (left cyan, right magenta), 2 ohms (gray). (1dB/vertical div.)
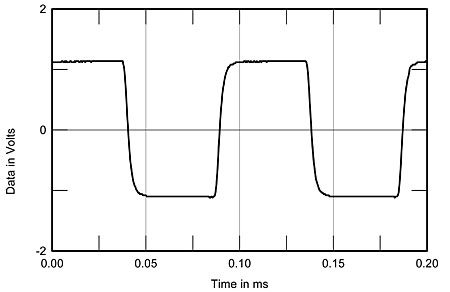
Fig.2 Luxman M-800A, small-signal 10kHz squarewave into 8 ohms.
Channel separation was very good, at 90dB in both directions at 1kHz, though it did decrease to 70dB at the top of the audioband (not shown). The amplifier's wideband, unweighted signal/noise ratio (ref. 1W into 8 ohms with the input short-circuited) was modest, at 52.7dB, though this increased to an excellent 81dB when the measurement bandwidth was restricted to the audioband, and increased further, to 83.5dB, with an A-weighted measurement.
The M-800A is a low-distortion amplifier. Fig.3, for example, plots the THD+N percentage against output power into 8, 4, and 2 ohms. The Luxman is specified as delivering a continuous 60Wpc into 8 ohms (17.8dBW) at <0.009% THD+N (footnote 1). This is not the power at clipping, however; at 1% THD+N (our standard definition of waveform clipping), the M-800A delivered no less than 160Wpc into 8 ohms (22dBW) and 280Wpc into 4 ohms (21.5dBW), both figures measured with both channels driven. And while the rise in distortion above 50W in fig.3 shows that the amplifier is clearly working harder than it probably likes to into 2 ohms, it still manages to deliver 480W into that load (20.9dBW) at 1% THD+N with one channel driven.
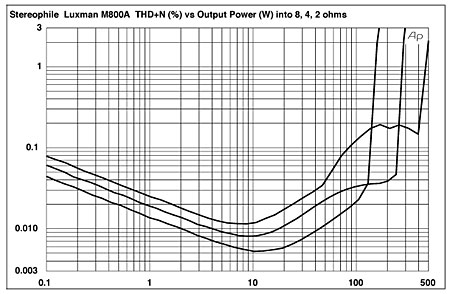
Fig.3 Luxman M-800A, distortion (%) vs 1kHz continuous output power into (from bottom to top at 100W): 8, 4, 2 ohms.
Fig.4 plots the THD+N percentage present in the Luxman's output as it drives 8 and 4 ohm loads at an output voltage of 10V, the level where fig.3 indicates that the THD components begin to rise out of the noise floor. The high-frequency rise in THD above the very low level in the midrange and bass is due to the circuit's diminishing open-loop bandwidth—there is less gain margin available for the negative feedback loop to do its distortion-reducing thing. Neither channel behaves appreciably differently as the load impedance is reduced from 8 ohms (red trace) to 4 ohms (magenta). However, this plot was taken with the amplifier cold. Once it had warmed up, the midband distortion rose by a factor of four into 4 ohms. Though the absolute level of the THD was still low, this behavior was a little alarming, as looking at the oscilloscope display, the rise in THD into low impedances appeared to be due to a small burst of ultrasonic noise appearing on every positive peak of the waveform.
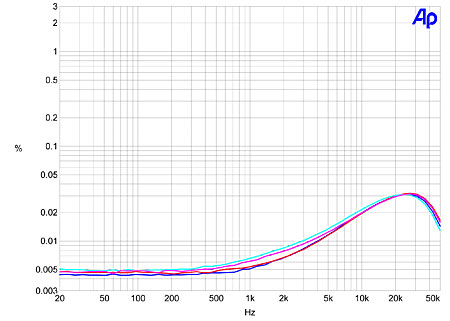
Fig.4 Luxman M-800A, THD+N (%) vs frequency at 8V into 8 ohms (left channel blue, right red) and 4 ohms (left cyan, right magenta).
I repeated the measurement once the amplifier had cooled down, and it behaved perfectly again. And again, once it had heated up, the ultrasonic noise appeared if I used the M-800A to drive loads of 4 ohms or lower. However, now the M-800A wouldn't drive 2 ohms without instability developing. I checked my cables, replaced my dummy load with another, and repeated the measurement using the Audio Precision System One rather than the SYS2722. There was no change in the amplifier's apparent unhappiness at driving low impedances once it had warmed up.
The main distortion component with the Luxman driving higher impedances was the subjectively benign second harmonic (fig.5). However, the left channel also offered some third harmonic (fig.6), though it's fair to note that both the second and third harmonics lie at very low levels, and that no higher-order harmonics are present in this graph. However, a regular series of spuriae can also be seen at odd multiples of the AC mains frequency of 60Hz (180Hz, 300Hz, 420Hz, 540Hz, etc.), particularly in the right channel. All of these are at or below –105dB, and so will be inaudible, but they do suggest the presence of magnetic coupling between the M-800A's power-supply transformer and the audio circuitry. Dropping the load to 4 ohms (fig.7) doesn't affect the level of the AC spuriae but does increase the level of the harmonics, particularly in the left channel (blue trace), and the noise floor rises, due to the bursts of noise accompanying the positive waveform peaks that I mentioned earlier affecting the measurement.
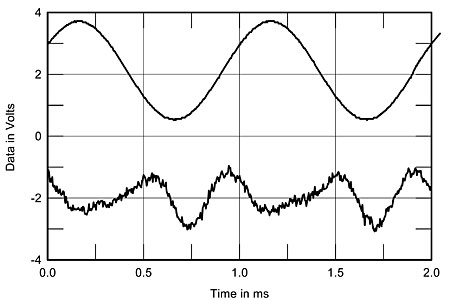
Fig.5 Luxman M-800A, 1kHz waveform at 10W into 8 ohms (top), 0.0056% THD+N; distortion and noise waveform with fundamental notched out (bottom, not to scale).
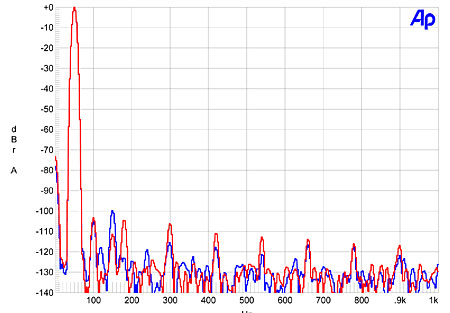
Fig.6 Luxman M-800A, spectrum of 50Hz sinewave, DC–1kHz, at 34W into 8 ohms (linear frequency scale; left channel blue, right red).
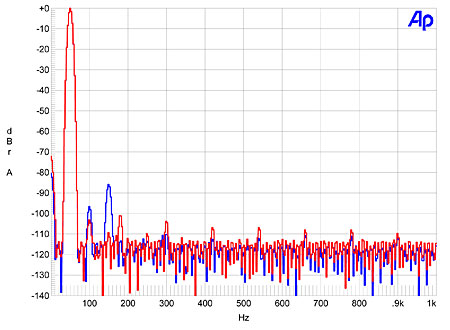
Fig.7 Luxman M-800A, spectrum of 50Hz sinewave, DC–1kHz, at 65W into 4 ohms (linear frequency scale; left channel blue, right red).
Finally, the M-800A's decreasing linearity at high frequencies leads to the appearance of some intermodulation products with the demanding 19+20kHz signal (fig.8), though these are still at a low level in absolute terms.
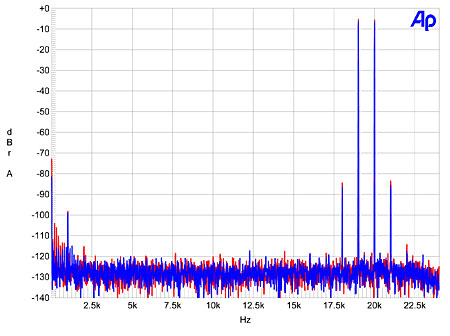
Fig.8 Luxman M-800A, HF intermodulation spectrum, DC–24kHz, 19+20kHz at 30W peak into 8 ohms (linear frequency scale; left channel blue, right red).
Overall, the Luxman M-800A performed well on the test bench. However, given how well Michael Fremer found the amplifier to perform with his Wilson MAXX 2s, I do wonder if our review sample had developed a possibly atypical problem regarding its relative misbehavior into lower impedances once it had warmed up.—John Atkinson
Footnote 1: Although it doesn't say so in the M-800A's literature, I suspect that this is the maximum power the amplifier will deliver in full class-A. At higher powers, the output stage progressively transitions into class-B operation until the amplifier eventually reaches its output voltage limit.
|
| ||||||||||
- Log in or register to post comments


| Loudspeakers Amplification Digital Sources | Analog Sources Accessories Featured | Music Columns Retired Columns | Show Reports | Features Latest News Community | Resources Subscriptions |
 © 2024 Stereophile
AVTech Media Americas Inc., USA
All rights reserved

