| Columns Retired Columns & Blogs |
What does this mean? That the "absolute sound" of a component is all that matters? Horrid measurements have no effect on what some of the best ears in the business can perceive? Yikes!
I examined the Lector Digitube S-192's measured behavior with my top-of-the-line Audio Precision SYS2722 system (see www.ap.com and the January 2008 "As We See It"). For some tests, and to check the results of others with a different measurement system, I used my vintage Audio Precision System One DSP.
I used my 2012-vintage Apple MacBook Pro, running on battery power, to examine the processor's performance via its USB port. Apple's USB Prober utility identified the Lector as having the manufacturer string "Lector" and the product string "Doect-Lector," though the AudioMIDI utility reported the product as being the "Lector-a." USB Prober appeared to indicate that the Digitube operated in isochronous adaptive mode rather than the preferred isochronous asynchronous mode. AudioMIDI also reported that while the USB port would accept 16- and 24-bit data (but not 32-bit), the sample rates on offer were 44.1, 48, 88.2, 96, 176.4, and 192kHz, but not the specified 384kHz. The AES/EBU and S/PDIF inputs, including TosLink, locked to datastreams with sample rates ranging from 32 to 192kHz.
The single-ended outputs preserved absolute polarity (ie, were non-inverting), and the maximum output level at 1kHz into 100k ohms was a high 3.77V, 5.5dB greater than the CD standard's 2V. The output impedance at high and middle frequencies was low, at close to the specified 250 ohms, but rose to 955 ohms at the bottom of the audioband. The Lector's impulse response with 44.1kHz (fig.1) was usual for a digital FIR reconstruction filter, with symmetrical "ringing" either side of the impulse. The magenta and red traces in fig.2 reveal that while this filter rolls off the output sharply above the audioband with 44.1kHz data, it doesn't reach full attenuation until 2kHz or so above the Nyquist Frequency (half the sample rate, shown by the vertical green line). The image at 25kHz of a full-scale tone at 19.1kHz (cyan and blue traces) was therefore suppressed by 75dB, but this graph also shows fairly high levels of harmonic products, the second, at 38.2kHz, lying at –48dB (0.32%). The shape and level of the ultrasonic noise floor also appear to be signal dependent, with the left channel's floor higher than the right's.
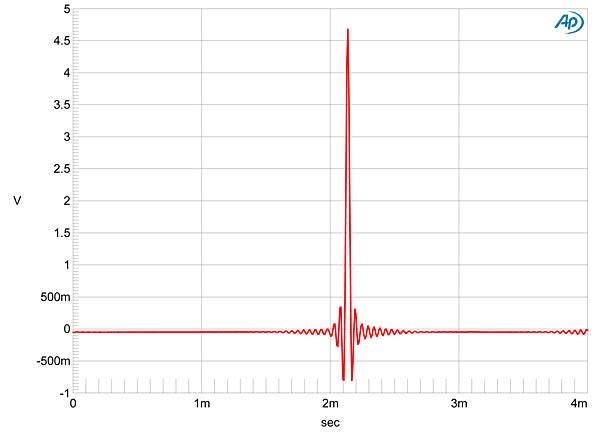
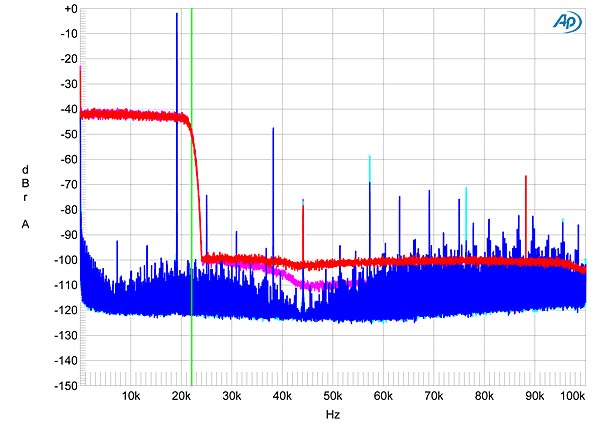
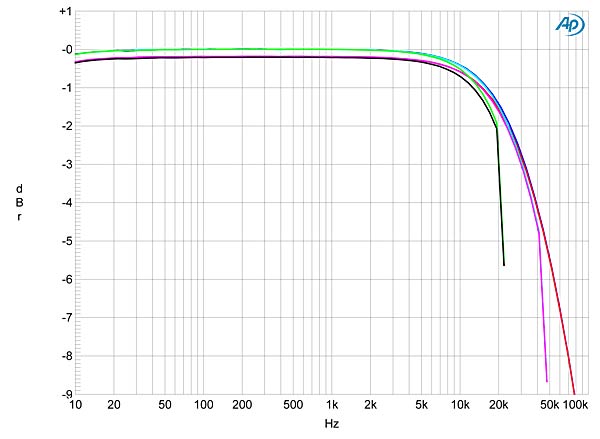
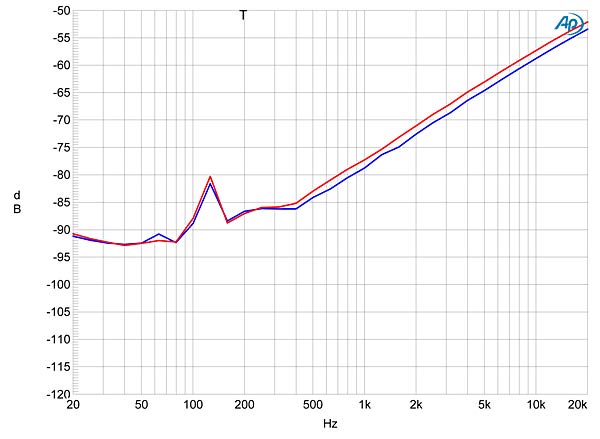
Fig.3 shows a more conventional examination of the Digitube's frequency response, taken with spot tones at sample rates of 44.1kHz (green and gray traces), 96kHz (cyan, magenta), and 192kHz (blue, red). The response at each sample rate follows the same shape, with a gentle rolloff starting at around 10kHz and reaching –1.5dB at 20kHz, broken by a sharp drop just below each Nyquist frequency. Channel separation (fig.4) was disappointing, at <55dB in both directions at 20kHz, increasing to an acceptable 85dB at low frequencies.
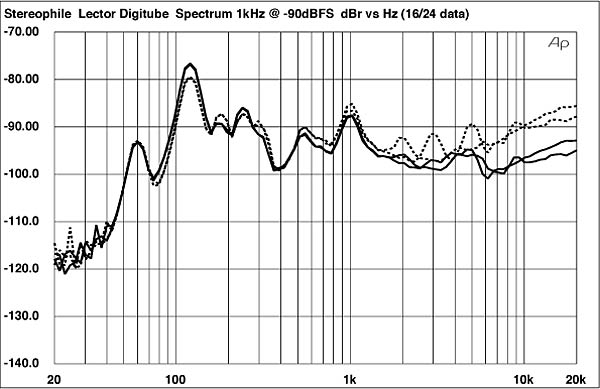
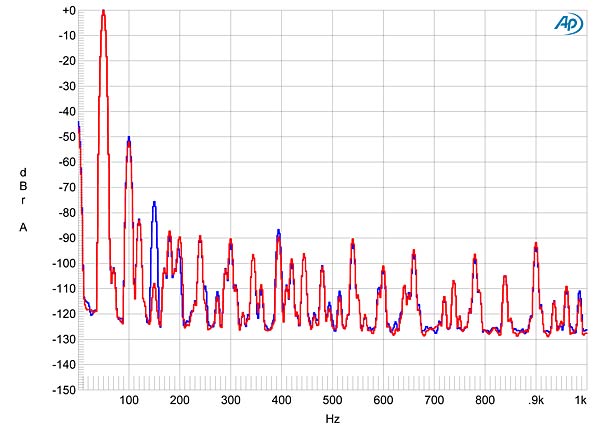
My usual test for a digital processor's resolution is to feed it dithered data representing a 1kHz tone at –90dBFS and examine how much the noise floor drops when the bit depth of the data is increased from 16 to 24. However, with my usual FFT technique I got anomalous results (fig.5). While a small drop in the higher-frequency noise floor can be seen with 24-bit data (blue and red traces), the noise floor is polluted with low-level power-supply components, and the 24-bit traces are affected by high levels of odd-order harmonic products, these generally indicating truncation of the word length. In addition, the spectral spike at 1kHz is higher than the expected –90dBFS, suggesting some low-level compression. I repeated the spectral analysis with the older Audio Precision, sweeping a 1/3-octave bandpass filter from 20kHz down to 20Hz. The results are shown in fig.6: again, there is an error in absolute level, there is no significant increase in resolution with 24-bit data, and the right channel appears to suffer from word-length truncation.
These days I don't usually publish plots of linearity error, as modern DACs are uniformly excellent in this regard. However, as can be seen in fig.7, the Lector D/A processor suffers from increasing linearity error below –75dB, and the smooth appearance of the trace suggests that this is actual level error rather than the effect of a random noise floor. For reference, fig.8 shows what an undithered 16-bit sinewave at exactly –90.31dBFS should look like: symmetrical about the time axis, with the three DC voltage levels described by the data clearly apparent. By contrast, fig.9 shows the Digitube's reproduction of this waveform: a noisy sinewave overlaid with positive- and negative-going spikes at the same frequency. Something is dreadfully wrong with the Digitube's handling of low-level data. Increasing the word length to 24 bits gave no change in the shape of the waveform other than the fact that the amplitude of the spikes was somewhat higher (not shown), suggesting that the Lector DAC is incapable of correctly handling 24-bit data.
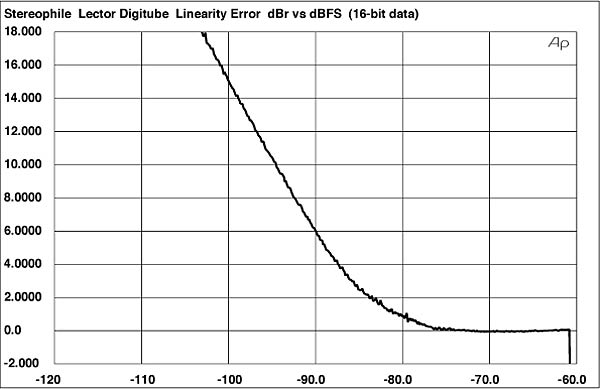
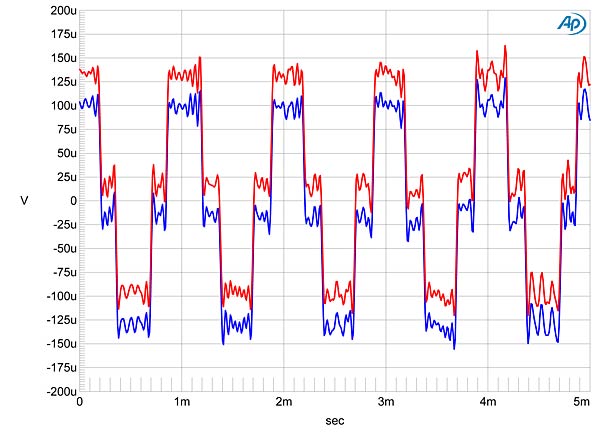
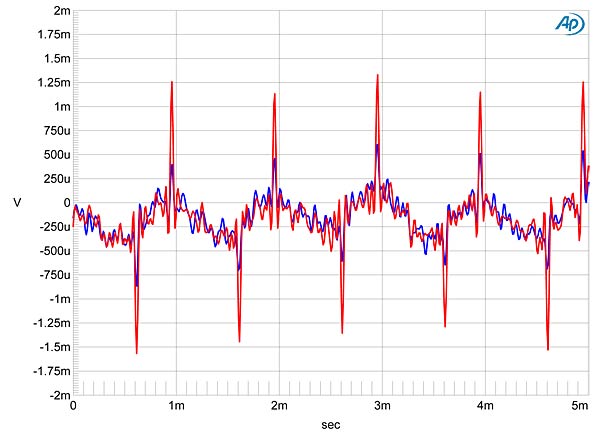
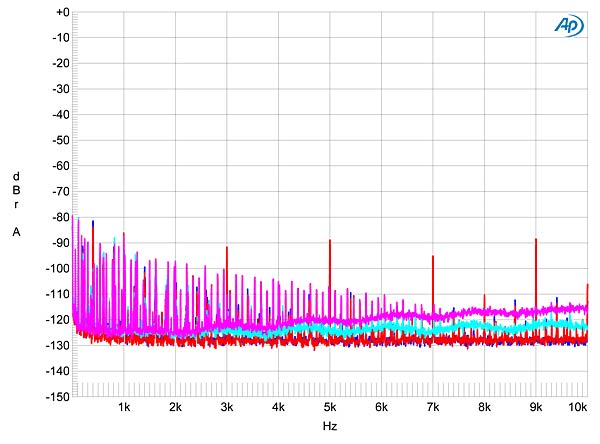
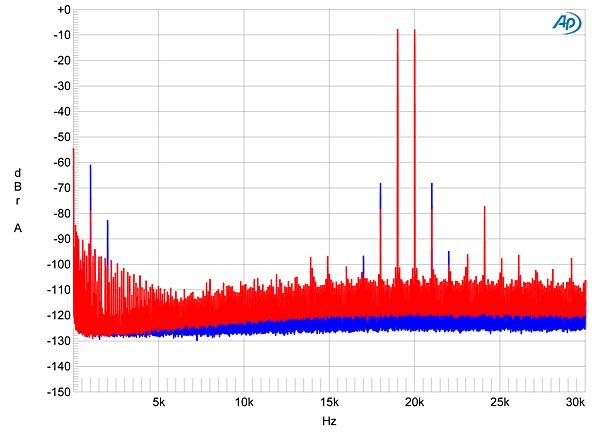
Fig.10 shows the spectrum of the Lector's output while it drove a full-scale 50Hz tone into 100k ohms. This is a high load, but even so, the second harmonic at 100Hz is fairly strong, at –50dB (0.3%), and a regular series of AC-supply components can be seen, the highest in level being 120Hz at –83dB. I experimented with every way of grounding the Digitube to both Audio Precision analyzers, but nothing changed the power-supply interference, which can also be seen in the spectrum of the Lector's output while it decoded 24-bit data representing a full-scale mix of 19 and 20kHz tones (fig.11). The left channel (blue trace) produces significantly more intermodulation than the right, but both of these graphs strongly suggest that the Digitube should not be used with preamplifiers having input impedances below 20k ohms.
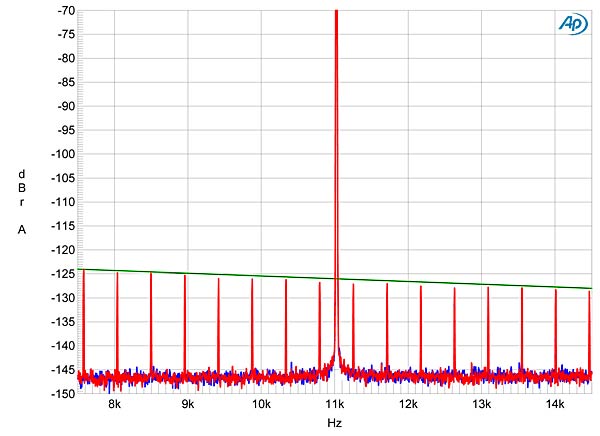
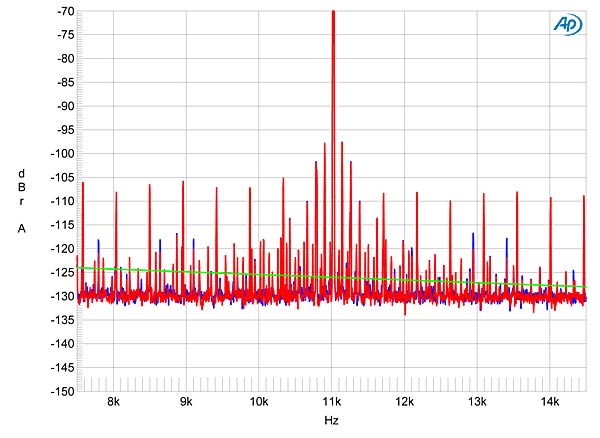
I test for a digital processor's ability to reject word-clock jitter by feeding it undithered data representing the Miller-Dunn J-Test signal—a high-level tone at exactly 1/4 the sample rate accompanied by an LSB-level squarewave at 1/192 the sample rate—and performing narrowband spectral analysis of the resultant analog output signal. The result with 44.1kHz data should look like fig.12: a narrow spectral spike at 11.025kHz with a regular series of the odd-order harmonics of the low-frequency squarewave decreasing from left to right, their undistorted levels shown by the green line. By contrast, fig.13 shows the result for the Lector Digitube fed 16-bit S/PDIF data via TosLink. This is dreadful performance! Not only has a strong pair of sidebands appeared at the power-supply frequencies of 11.025Hz, ±120Hz, but all the odd harmonics have been increased in level, as has the overall noise floor. Repeating the analysis with 24-bit data produced no change in the picture, nor did repeating the test with USB data, which should be immune to word-clock jitter—the result was equally bad.
In the past year or so Stereophile has reviewed several superbly engineered D/A processors in the Lector's price class—from Arcam, Auralic, Ayre, Electrocompaniet, Marantz, and Musical Fidelity—as well as less expensive products that measure as well, from Benchmark and NAD. I know that Art Dudley wrote that he can "heartily recommend Lector Strumenti Audio's Digitube S-192 for the musicality it displayed in my system," and I have the utmost respect for AD's listening abilities. However, the Digitube's truly dreadful measured performance in the digital domain, along with its disappointing showing in the analog domain, rule it out of contention, in my opinion.—John Atkinson
|
| ||||||||||

What does this mean? That the "absolute sound" of a component is all that matters? Horrid measurements have no effect on what some of the best ears in the business can perceive? Yikes!
I think something is misconfigured. I have never seen or measured an AKM device that was so far from correct operation. You can see measured results for the chip here: http://www.akm.com/akm/en/file/ev-board-manual/AK4397EQ.pdf Everything indicates a problem with the board or with the specific device.
Is it possible that the analog electronics could be the cause of the non-linearity? It seems unlikely but getting the digital side so misconfigured and still working is not easy.
Obviously non-linearity at -90 dB doesn't scream at reviewers saying "I sound bad!" but MP3's demonstrated how much audio can be removed and still have "decent" audio.

FWIW, in the "Manufacturers' Comments" section, Lector Strumenti's US representative states that the designer "deliberately sacrifices measured performance to achieve his design objectives, the most obvious one being superior musicality" and seems not to think that the measurements are unexpected.

I read the comment. Looks like a well written manufacturer damage control comment that just regurgitates a number of adjectives from the subjective review (which more likely demonstrates hearing limitations).
Good for John Atkinson to say it as it is. A device that costs a significant chunk of change, that's marketed with big numbers (ooohhh "32 bit DAC from AKM" as seen on the web site, capable of 192kHz and 384kHz) but in reality you'd be wasting dollars feeding this baby >16-bit audio data.
It'd be a shame to think that "musicality" is achieved by sacrificing dynamic range.
..is that in order to make a digital product sound good, you need someone incompetent to design it. Sign me up!
Damage control is not to double down on a bad result. Damage control is normally to attack the measurer or to "discover" on its return that the unit was broken somewhere along the line. Or to announce revisions to the product "since" the review.
This manufacturer has a far more interesting response than damage control.
graph 12 is for sony?
Fig.12 Sony HAP-Z1ES, high-resolution jitter spectrum of analog output signal, 11.025kHz at –6dBFS, sampled at 44.1kHz with LSB toggled at 229Hz: 16-bit internal data (left channel blue, right red). Center frequency of trace, 11.025kHz; frequency range, ±3.5kHz.
and comment is wrong?
maybe this measurement are all fake!
manufacture web site say: setup the dac in service mode for measurement !

graph 12 is for sony?
That's correct and fig.8 is for the MSB Analog DAC. Both are examples of what the measured performance on these tests should look like.
maybe this measurement are all fake!
No, they are not fake. The manufacturer stated that the measurements correctly characterized the product in his published comment.
manufacture web site say: setup the dac in service mode for measurement !
As the reviewer didn't audition the Lector DAC in "service mode," I didn't feel that to be relevant.
John Atkinson
Editor, Stereophile
I think as a matter of testing protocol it would have been better to additionally do the measurements and do some listening in service mode.
For the measurements then we could at least have an inkling whether the manufacturer is even capable of designing gear which will measure conventionally, a pretty important piece of data. Then listening to service mode would possibly indicate whether the manufacturer's choice of poorly measuring configurations actually yielded some audible benefit...in one person's system, at least.
I understand then in terms of workload it's like doing two reviews, though, but I'd be really curious about all this.
(Also, as an aside, in my quite old Camino trying to preview and edit my post twice before hitting "save" results in my getting trapped in an endless loop always returning me to preview mode...even when I do eventually hit "save." Either that or I will have double posted, as happened sometimes with the old messaging system here.)
service mode is for measure test non for listening.
feedback email with manufacture, without service mode setup internnally switch the dac stay in soft mute condition, so the measure are wrong
A claim to be tested as is any other claim about specs from...whom? A manufacturer?
Speaker companies say their speakers have a certain efficiency; then the efficiency of the speakers gets tested.
One mode allegedly measures well. We don't know that. It wasn't tested.
Not too difficult.
You write that the Lector uses 32 bit AK4397 DAC chips.
AK4397 is a 24 bit DAC chip which is obsolete.
If it is in fact a 32 bit chip, then it must be AK4399, which I think is also obsolede by now.
You also describe that the I/V conversion is done discretely with use of only resistors.
This cannot be true, as both AK4397 and AK4399 are both U (voltage) out converters, which in general do not require I/V conversion at all.
Anyways I cannot believe that sound would not be bettered, if the measurable components were optimized.


| Loudspeakers Amplification Digital Sources | Analog Sources Accessories Featured | Music Columns Retired Columns | Show Reports | Features Latest News Community | Resources Subscriptions |
 © 2024 Stereophile


