| Columns Retired Columns & Blogs |
Lavry Engineering DA2002 D/A processor Measurements
Sidebar 3: Measurements
Footnote 1: For historical reasons, so that my current measurements of digital components can be directly compared with those published by Stereophile going back to 1989, I use a swept 1/3-octave filter for this measurement.—John Atkinson
The Lavry DA2002's maximum output level was to specification at 4.45V balanced and 2.02V unbalanced, both figures measured into 100k ohms. The output polarity was noninverting with the Invert LED off. The source impedance at 1kHz from the balanced XLR jacks was 61 ohms (including the series resistance of 6' of cable), this halving as expected from the unbalanced RCA jacks.
Fed CD data, the DA2002's frequency response was basically flat within the audioband (fig.1, bottom traces above 2kHz), though the right channel had a very slight rolloff above 10kHz, reaching -0.3dB at 20kHz. This is inconsequential. However, when fed pre-emphasized CD data, the Lavry DAC didn't switch in the appropriate de-emphasis, resulting in a boosted treble (fig.1, top traces above 2kHz). Though pre-emphasized CDs are relatively rare, this behavior surprised me.
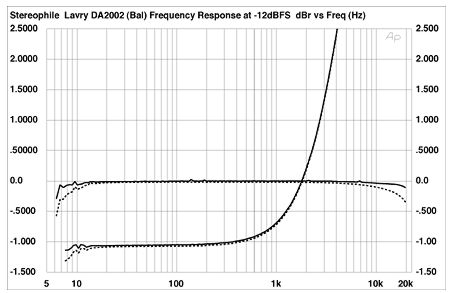
Fig.1 Lavry DA2002, frequency response at -12dBFS into 100k ohms, 44.1kHz sample rate, with de-emphasis (bottom) and without (top). (Right channel dashed, 0.5dB/vertical div.)
I was also surprised by the DA2002's behavior when fed high-sample-rate data. Fig.2 shows its response with 96kHz data: it rolls off a little earlier above the audioband, reaching -3dB at just below 30kHz. The effect of this will be arguable—certainly no one will hear this rolloff—and perhaps it reveals optimized time-domain behavior on the part of the Lavry's reconstruction filter, though some claim this is also inaudible.
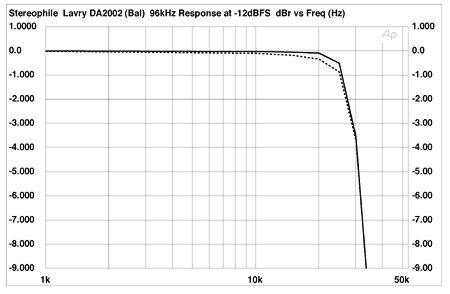
Fig.2 Lavry DA2002, frequency response at -12dBFS into 100k ohms, 96kHz sample rate (right channel dashed, 0.5dB/vertical div.).
Channel separation (not shown) was around 105dB below 5kHz, which probably means it was below the noise floor. The Lavry DAC's intrinsic noise was low, meaning that the noise floor shown in the top pair of traces in fig.3, which shows a spectral analysis (footnote 1) of the DA2002's analog output while it decoded dithered data representing a 1kHz tone at -90dBFS, is that of the recorded dither. Increasing the word length of the incoming data to 24 bits dropped the noise floor by approximately 12dB above 200Hz (fig.3, middle traces), implying the Lavry's actual resolution is around the 18-bit level. While this is not the best I have measured—that honor goes to the Weiss and Benchmark DACs—it is good enough to allow the DA2002 to reproduce a dithered tone at -120dBFS (fig.3, bottom traces).
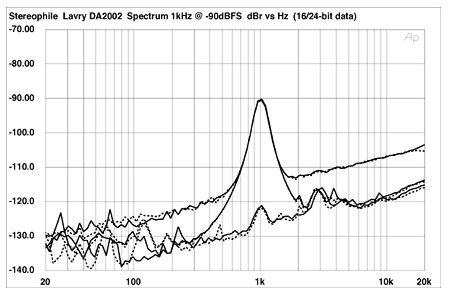
Fig.3 Lavry DA2002, 1/3-octave spectrum of dithered 1kHz tone at -90dBFS, with noise and spuriae, 16-bit CD data (top) and 24-bit data (middle); and of dithered 1kHz tone at -120dBFS, 24-bit data (bottom). (Right channel dashed.)
Correlating with the DA2002's excellent resolution, the DAC's linearity error assessed with 16-bit data really shows only the contribution of the recorded dither (fig.4). Repeating the test with dithered 24-bit data (fig.5) reveals zero error down to -100dBFS, with then just 1dB of negative error apparent at -120dBFS. The DA2002's reproduction of an undithered tone at -90.31dBFS was perfect (fig.6), the three DC voltage levels and the transitions between them clearly described.
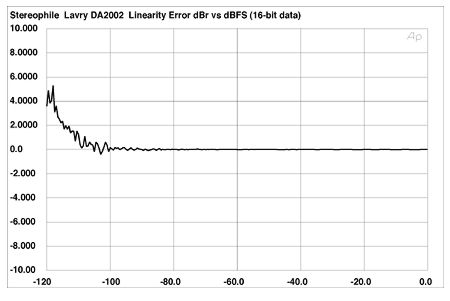
Fig.4 Lavry DA2002, linearity error, 16-bit data (2dB/vertical div.).
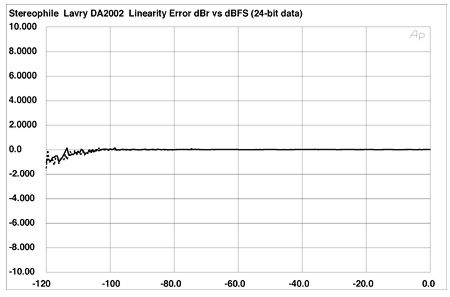
Fig.5 Lavry DA2002, linearity error, 24-bit data (2dB/vertical div.).
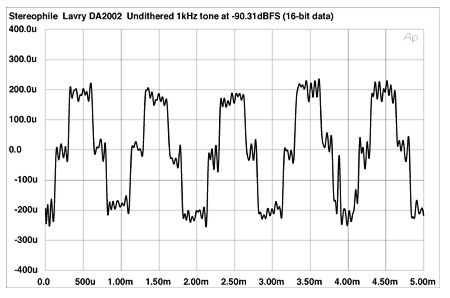
Fig.6 Lavry DA2002, waveform of undithered 1kHz sinewave at -90.31dBFS.
As with other high-performance D/A processors, testing the DA2002 for distortion was complicated by the fact that my test gear uses 16-bit A/D converters. It should be borne in mind that the noise floors shown in the following graphs are actually those of the test gear, not the DA2002. The noise will therefore appear to drop with decreasing level, as the 16-bit dynamic-range "window" tracks the signal level. (The distortion harmonics shown are representative of the Lavry DAC, however.)
Fig.7 shows an FFT-derived spectral analysis of the DA2002's analog output with it fed dithered 24-bit data representing a 1kHz tone at 0dBFS. The only significant harmonics present are the second, third, and fourth, all of which lie below -100dBFS—with the exception of the second harmonic in the right channel, which lies at -97dBFS (0.0014%). The measured THD (actual sum of the harmonics) was 0.0008% left and 0.016% right, both well below the threshold at which humans can begin to hear these low-order harmonics. However, when I reduced the signal level to -30dBFS (fig.8), not only did the THD figure rise as expected (to 0.006% left and 0.0065% right), but the low-order harmonics were joined by the fifth, sixth, and seventh, where the audibility thresholds are lower. Again, it's extremely unlikely that these extra harmonics will be audible, but I wasn't expecting them any more than I was the discrete tones that can be seen below 4kHz. (As these lie below -120dBFS, their presence is academic.)
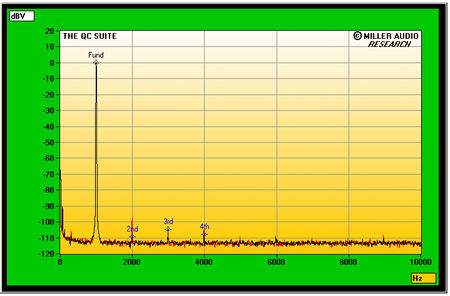
Fig.7 Lavry DA2002, spectrum of 1kHz sinewave, DC-1kHz, at 0dBFS into 4k ohms (linear frequency scale).
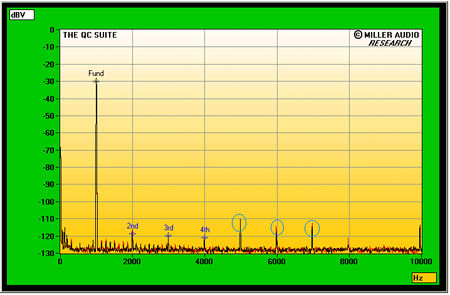
Fig.8 Lavry DA2002, spectrum of 1kHz sinewave, DC-1kHz, at -30dBFS into 4k ohms (linear frequency scale).
Dropping the signal level to -90dBFS gave the spectra shown in fig.9. The second through fourth harmonics are very low, with the fifth and seventh the highest in level, neither of which I was expecting from the swept 1/3-octave analysis of the DA2002's output fed the same data (fig.3, middle traces). However, that was taken from the balanced outputs, while figs.6-8 were taken from the unbalanced output. Fig.10 was also taken from the Lavry's unbalanced output; it shows the spectrum of the processor's output while it decoded data representing an equal mix of 19kHz and 20kHz tones, the combined waveform peaking at 0dBFS. The 1kHz difference component lies at -90dBFS, which, while not as low as with some other DACs I have measured with these data, still represents good performance.

Fig.9 Lavry DA2002, spectrum of 1kHz sinewave, DC-1kHz, at -90dBFS into 4k ohms (linear frequency scale).
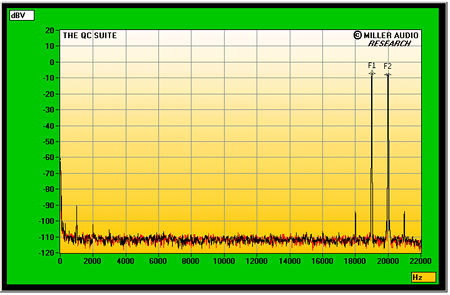
Fig.10 Lavry DA2002, HF intermodulation spectrum, DC-22kHz, 19+20kHz at 0dBFS into 4k ohms, CD data (linear frequency scale).
Finally, Lavry's literature discusses at some length the measures the design team has taken to reject word-clock jitter on the incoming data. Fig.11 shows a narrowband spectral analysis of the DA2002's output while it decodes 24-bit/44.1kHz data representing the analytical J-Test signal (a high-level tone at exactly Fs/4, 11.025kHz, over which has been laid a low-frequency squarewave at the LSB level, again at exactly an integer fraction of the sample rate, Fs). Word-clock jitter manifests itself as symmetrical sideband pairs around the central peak. The Miller Audio Research Analyzer I used (running on a National Instruments data-acquisition PC card) identifies these sidebands and calculates their level in picoseconds. The source for these measurements was a WAV file on my PC, fed to the DA2002 via an RME soundcard and a TosLink datalink, which was converted to AES/EBU with a Sonic Solutions converter. I used an optical output to break the ground connection that would otherwise exist between two PCs.
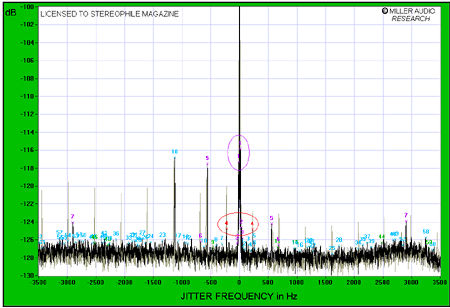
Fig.11 Lavry DA2002, high-resolution jitter spectrum of analog output signal (11.025kHz at -6dBFS sampled at 44.1kHz, 24-bit with LSB toggled at 229Hz). Center frequency of trace, 11.025kHz; frequency range, ±3.5kHz. (Grayed-out trace is with 16-bit data.)
Assessed with this technique, the DA2002's jitter was one of the lowest I have measured: just 124.4ps peak-peak. The only sidebands that can be seen above the noise floor are a data-related pair at ±229Hz (red "4" markers), low-frequency pairs at ±15.6Hz and ±31.2Hz (purple "1" and "2," respectively), and a pair at ±577Hz (purple "5"). (The spike marked with a blue "18" is a spurious tone that seems to be radiated from the analyzer's host PC and should be ignored.) Only the sidebands at ±15.6Hz and ±577Hz are significant, but even then, their levels are so low that it is hard to imagine they have any audible effect.
Reducing the incoming word length increased the measured jitter to a still extremely low 154.5ps (grayed-out spectrum), mainly due to the appearance of sidebands at harmonics of the signal-related 229Hz. But, as explained by Keith Howard in a recent issue of HFN, these are actually the residual harmonics of the squarewave, not jitter-related sidebands.
The Lavry DA2002's jitter measurements are among the best I have encountered. I am sure this contributes to the analog-like ease that typified its sound quality.—John Atkinson
Footnote 1: For historical reasons, so that my current measurements of digital components can be directly compared with those published by Stereophile going back to 1989, I use a swept 1/3-octave filter for this measurement.—John Atkinson
|
| ||||||||||
- Log in or register to post comments


| Loudspeakers Amplification Digital Sources | Analog Sources Accessories Featured | Music Columns Retired Columns | Show Reports | Features Latest News Community | Resources Subscriptions |
 © 2024 Stereophile
AVTech Media Americas Inc., USA
All rights reserved

