KEF Reference Series 103/4 loudspeaker Measurements

Sidebar 2: Measurements

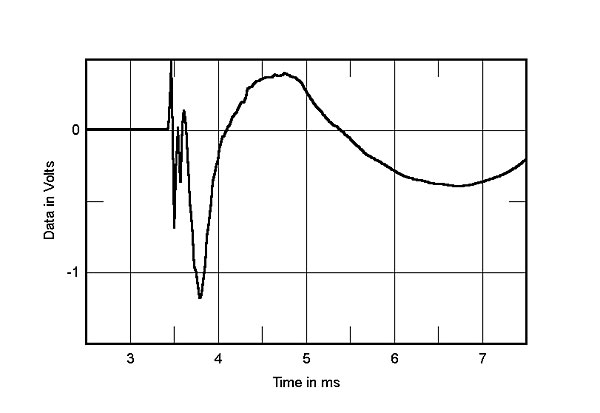
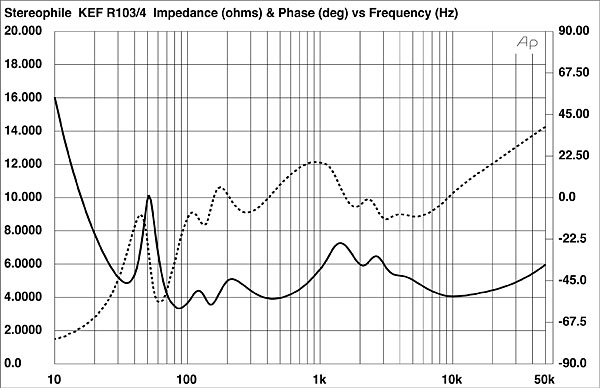
All of the measurements were taken with the Kube out of the circuit. The impedance of the KEF 103/4 is shown in fig.1. The minimum at about 85Hz is actually the tuning of the port; the large rise at the bottom of the range (around 10Hz) appears to be due to a large, DC blocking capacitor in series with the network. Note also that the Conjugate Load Matching crossover, while keeping the response's magnitude reasonably linear above about 60Hz, is not as effective as that in the more expensive KEF R107/2 (Vol.13 No.5, p.114). The impulse response (fig.2) is rather strange. Reflections from the tweeter off of the outside edge of the midrange cone could be partially to blame for the unusual shape. But it's hard to be certain. The step response is shown in fig.3, and suggests that the tweeter is connected in positive acoustic polarity, the midrange unit in negative polarity.

692K1034fig01.jpg

Fig.1 KEF Reference 103/4, electrical impedance (solid) and phase (dashed) (2 ohms/vertical div.).

692K1034fig02.jpg

Fig.2 KEF Reference 103/4, impulse response on tweeter axis at 50" (5ms time window, 30kHz bandwidth).

692K1034fig03.jpg

Fig.3 KEF Reference 103/4, step response on tweeter axis at 50" (5ms time window, 30kHz bandwidth).

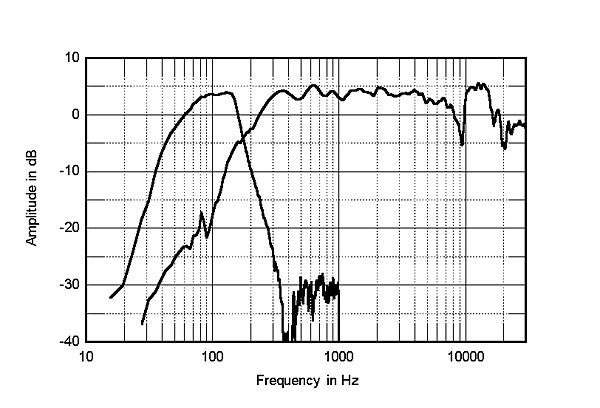
To the right of fig.4, the anechoic response on the tweeter axis is averaged across a 30° lateral window. The response is very linear through the midrange, but note the dip and peak in the upper ranges, the former centered around 9kHz, the latter just above 10kHz. There is definitely something going on here which may have contributed to my discomfort with the 103/4's treble response. At the low end, the maximum port output at around 85Hz is consistent with its tuning. The response is down about 8dB from this point at 40Hz, 18dB at 30Hz, and crosses over to the midrange around 200Hz. Remember, this is a near-field, quasi-anechoic response; typical room reinforcement can be expected to considerably improve on the bass extension. One of the theoretical problems with bandpass woofers is that the port is transparent to midrange resonances. Note from fig.4 that what hash there is in the port's output is more than 30dB down from the reference level, an excellent result.

692K1034fig04.jpg

Fig.4 KEF Reference 103/4, anechoic response on tweeter axis at 50", averaged across 30° horizontal window and corrected for microphone response, with nearfield midrange and port responses plotted below 300Hz.

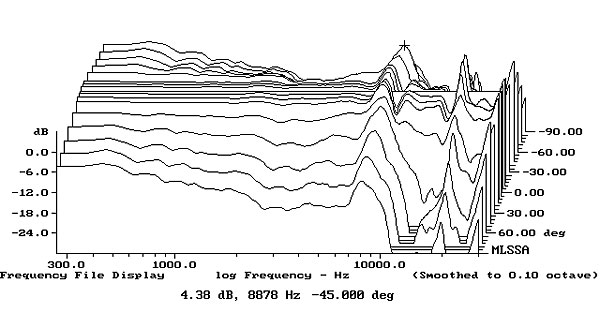
The horizontal response family, normalized to the on-axis response shown in the top curve and smoothed to 0.20 octave, is shown in fig.5. Note the peaking in the mid-treble, which begins almost immediately in the off-axis plots. (It is even more pronounced when smoothing is not applied.) Although this fills in the diffraction-related notch in the on-axis response seen in fig.4, it means that the reverberant room field features considerably more energy in this region, which correlates with my listening impressions. The 103/4 was not shooting BBs at me on axis, which would have been an immediate turn-off. But it was turning up the heat just out of my direct line of hearing, which gave it its brightened quality. It also explains why turning down the treble, broadband, with the Kube HF contour didn't really help the situation.

692K1034fig05.jpg

Fig.5 KEF Reference 103/4, lateral response family at 50", normalized to response on tweeter axis, from back to front: differences in response 90–15° off axis, reference response, differences in response 15–90° off axis.

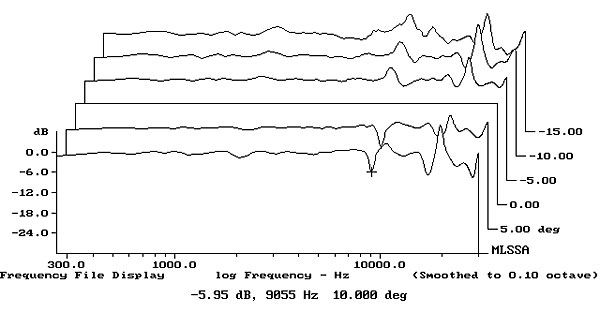
The vertical response family in fig.6, again normalized to a theoretically flat on-axis response for comparison, also shows some off-axis peaking, especially above the Uni-Q mid/treble driver. Theoretically these response curves should be the same as the lateral off-axis changes because of the coincident Uni-Q driver; the differences are probably due to differences in the cabinet geometry in the two planes. This off-axis behavior might well be at least partially the result of tweeter diffraction off of the midrange cone. Clearly the 103/4 should not be listened to from too high a perspective, validating my decision to elevate it several inches for the listening tests.

692K1034fig06.jpg

Fig.6 KEF Reference 103/4, vertical response family at 50", normalized to response on tweeter axis, from back to front: differences in response 15–5° above axis, reference response, differences in response 5–10° below axis.

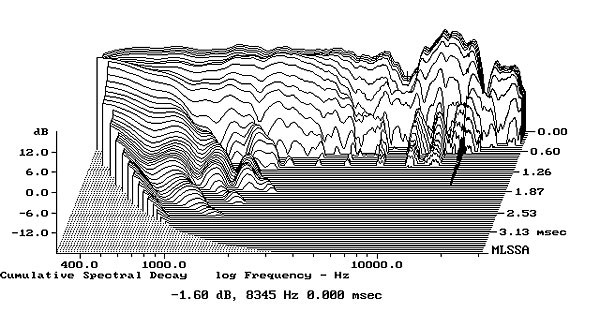
The waterfall plot (fig.7) is interesting as well. Note that, aside from the high-end dip and peak, this is actually a very impressive result, with a particularly low degree of grundge from the midrange and tweeter. For a striking comparison, look back at the result for the R107/2 referred to above. It has a decidedly flatter overall response and off-axis linearity, but its cumulative spectral decay is considerably messier. Does this mean that if the 103/4 had a smoother top-end response—on- and (especially) off-axis—that it might be a better loudspeaker than the 107/2, low-end extension excluded? An interesting "what if."

692K1034fig07.jpg

Fig.7 KEF Reference 103/4, cumulative spectral-decay plot on tweeter axis at 50" (0.15ms risetime).

A loudspeaker system is a vibration generator. Only some of those vibrations are ones you want to hear. The enclosure itself is alive with motion on a microscopic but clearly significant level. A significant portion of the radiation from a loudspeaker comes from the enclosure walls, all of it unwanted distortion. We recently acquired an accelerometer—a device which, to simplify matters a bit, responds to vibrations in the surface to which it is attached in an analogous fashion to the way a microphone responds to vibrations in the air. Using this device will enable us to investigate cabinet-wall vibrations in a bit more depth.

To be sure, the full significance of these measurements will only be clear after we have accumulated a significant number of them to compare and relate to our sonic impressions of the loudspeakers in question. These early results, therefore, are presented as additional, interesting data points. Their true significance, good or bad, may only become evident with time, though it is fair to point out that the lower the level in dB of the indicated modes, the better. The measurements were made by applying the signal from our MLSSA test set to the loudspeaker in the normal fashion, but by reading the loudspeaker enclosure's output with the accelerometer rather than measuring the system's acoustical output with a microphone. An FFT of the data was performed in the usual fashion, and a spectral-decay curve plotted out. Readings were taken at several points on the cabinet walls; the most interesting result for each loudspeaker is shown.

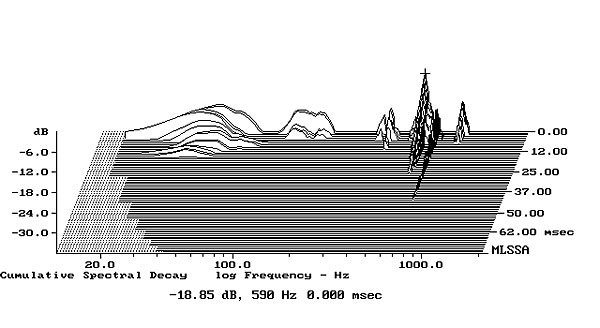
I noted the most pronounced vibrations from the KEF Reference 103/4 on its upper side panel (fig.8). There is a strong mode at 586Hz with a much lesser one around 1kHz, and what must the residual woofer tuning around 50Hz, with some complicated behavior around the port tuning frequency. Noticeable resonances just below 1kHz were also seen in a number of other plots, though with the exception of the top panel, these were much lower in level than in fig.8.

692K1034fig08.jpg

Fig.8 KEF Reference 103/4, cumulative spectral-decay plot calculated from output of accelerometer fastened to center of upper side panel (MLS driving voltage to speaker, 7.55V; measurement bandwidth, 2kHz).

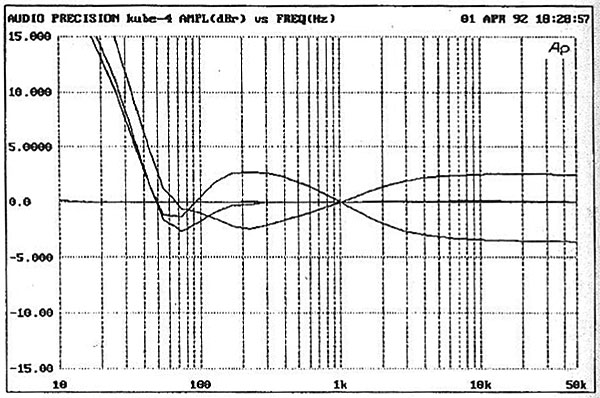
Turning to the KEF Kube 200, the rather busy graph in fig.9 indicates the Kube 200's frequency response in four different modes. In bypass, the response is a straight line across the zero axis. With both contour controls at maximum (top curve at the 10kHz point), the response dips to a minimum at 200Hz (about –2dB) and rises to a positive shelf of +2dB above 5kHz. With both controls at a minimum (bottom curve at the 10kHz point), the response rises to a peak of +2.5dB at 200–300Hz, then dips to a –3dB shelf above about 5kHz. And in the position in which I did much of my listening—treble control flat, bass control at 10:30—the response dips to a –2.5dB minimum at 70Hz and is flat above 300Hz. (All levels are referenced to 0dB at 1kHz.) Also note that the bass boost provided by the LF contour control below 50–70Hz is almost the same from the minimum setting to 10:30, increasing by 3 to 4dB at the maximum control setting.

692K1034fig09.jpg

Fig.9 KEF Kube 200, frequency response in bypass mode, with both cpontour controls at maximum and minimum, and with treble control flat, bass control at 1:30 (5dB/vertical div.).

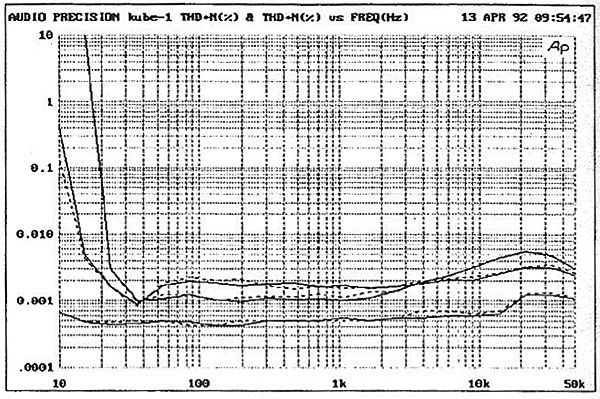
In fig.10 we see the Kube's THD+noise. The bottom curve is in bypass, the top curve (at 10kHz) is the distortion with a 2V input, contour controls centered, and the middle curve (again referenced at 10kHz) is the distortion with a 1V input, contour controls again centered. The rise in distortion at infrasonic frequencies is presumably due to the equalization. Luckily, music program has very little content in this region.

692K1034fig10.jpg

Fig.10 KEF Kube 200, THD+noise (%) vs frequency in bypass mode (bottom), for 1V input with EQ engaged (middle above 10kHz), and for 2V input with EQ engaged (right channel dashed).

The input impedance of the Kube 200 measured 46k ohms (±500 ohms, depending on setting) when switched in, 6010 ohms in the bypass mode. The output impedance measured between 100 and 111 ohms, depending upon setting, in the EQ mode, 33 ohms in the bypass mode.

Thomas J. Norton

COMPANY INFO
US distributor: GP Acoustics (US) Inc.
10 Timber Lane
Marlboro, NJ 07746
(732) 683-2356
ARTICLE CONTENTS

COMMENTS
kensargent's picture

I think what you mean is something other than that the woofers in the KEF 103/4 operate IN phase. For there to be any pressure generated in the central chamber, and thereby generation of any velocity at the port, the drivers must be OUT of phase, both electrically and mechanically. That is to say that as one of them moves away from its' frame, the other moves toward its' frame. As a result, the pressure in the central chamber is increased in one half of a cycle, and decreased in the other half of a cycle. This is the actual arrangement that would create the situation you describe: when the pressure is at maximum in the central cavity, it will be at minimum in the opposing cavities at the ends of the enclosure.

The rod connects the woofers' frames, surely, as this arrangement would, in fact, reduce vibration as the manufacturer states, but only if the cones were moving opposite each other. If the woofers were moving in phase, the rod would serve only to equalize, or average, the vibration, but not reduce it.

There are some arrangements in professional loudspeakers that put the woofers out of phase both mechanically and electrically, on an ordinary baffle, with one facing into the cabinet (front-loaded) and one facing out (rear-loaded.) In this arrangement, the advantage is said to be a cancellation of nonlinearities caused by the woofers' suspension, with the result reportedly being measurably lower distortion.
X