| Columns Retired Columns & Blogs |
JBL XPL-160 loudspeaker Measurements
Sidebar 2: Measurements
Fig.1 shows the magnitude and phase angle for the impedance of the XPL-160. The port is tuned to about 33Hz. The system's minimum impedance of 4 ohms indicates an easy load for any reasonably designed amplifier to drive.
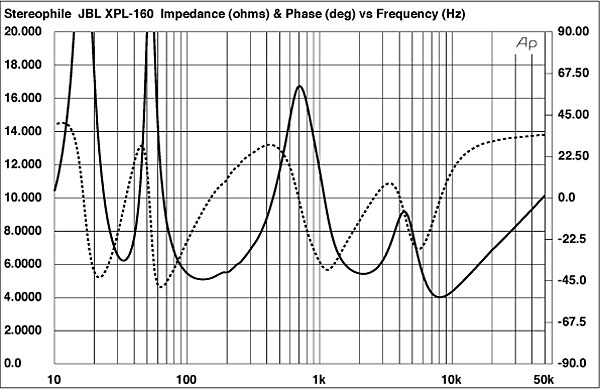
Fig.1 JBL XPL-160, electrical impedance (solid) and phase (dashed). (2 ohms/vertical div.)
Fig.2 shows the (MLSSA-derived) impulse response, the lazy hump typical of high-order crossovers. Particularly notable is the lack of ultrasonic ringing which is often visible on the tail of the impulse response, especially on systems with metal-dome tweeters. Fig.3 shows the step resposne on the same axis.
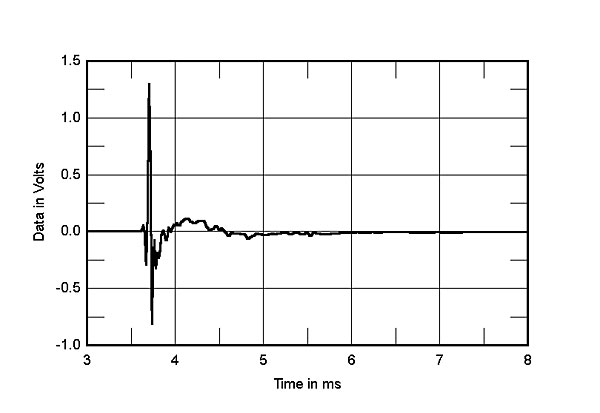
Fig.2 JBL XPL-160, impulse response on tweeter axis at 50" (5ms time window, 30kHz bandwidth).
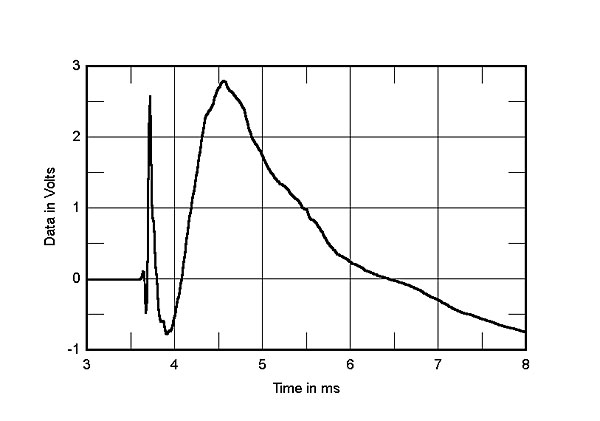
Fig.3 JBL XPL-160, step response on tweeter axis at 50" (5ms time window, 30kHz bandwidth).
Fig.4 shows the individual quasi-anechoic responses of the woofer and midrange/tweeter, indicating a crossover point of about 700Hz. Except for a bit of raggedness around 2–3kHz in the woofer plot—already about 20dB down at this point—the stop-band responses of the drivers in this region are well-behaved. Fig.5 is a composite of four measurements. Above 1kHz it shows the FFT anechoic response at 48" on the tweeter axis, taken with 90Hz resolution. Between 150Hz and 1kHz is the FFT response at 48" on-axis taken with 15Hz resolution. Below that is the nearfield woofer and rear-port responses, plotted separately. (Note that this has been scaled so that its peak output magnitude matches that of the woofer and does not necessarily indicate the relative in-room contributions of the driver and port.)
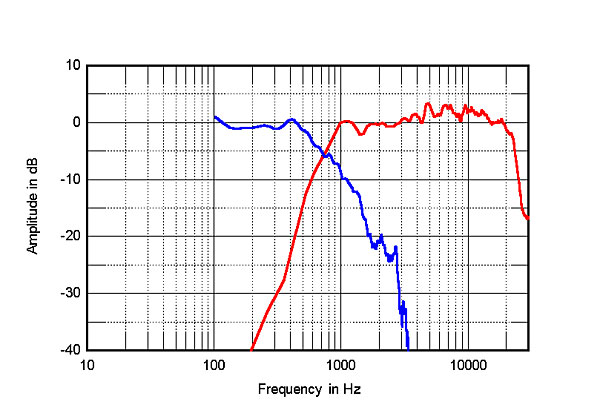
Fig.4 JBL XPL-160, quasi-anechoic responses of the woofer and midrange/tweeter.
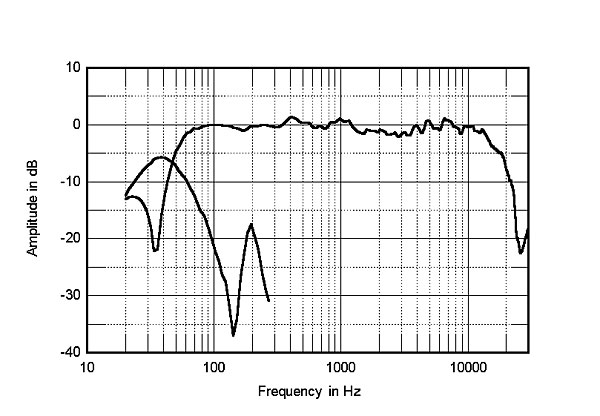
Fig.5 JBL XPL-160, anechoic response on tweeter axis at 48", corrected for microphone response, with nearfield responses of woofer and port plotted below 300Hz.
The overall measured response of the XPL-160 is very smooth throughout the low end, ripples slightly in the midrange, and is generally smooth throughout the treble with a slight rise at about 12–13kHz. The sharp peak in the output from the port at about 200Hz, though 15dB below the output of the woofer at the same frequency, may have some bearing on the reduced clarity noted in this region. So may the small response peak at 400Hz, though it appears relatively innocuous. As does the slight rise at 900Hz, which appears to originate in the 3" dome and might explain the subtle coloration noted in the upper midrange. The ear is sensitive in this region, and the 900Hz blip is +2 to +3dB, though very narrow.
Fig.6 shows the spectral-decay (waterfall) plot. The resonance just below 20kHz is due to the computer monitor in the test setup. A fair amount of hash is evident in the high frequencies all the way up to the top octave, but dies out by 2.3ms and was not apparent in the listening tests. A slight resonance is evident at around 4.7kHz, and another at around 900Hz. Note the significant reduction in stored energy just above that 900Hz resonance, after the transition from the woofer to the midrange driver. Also note the lack of a resonant peak in the metal-domed tweeter above 20kHz.—Thomas J. Norton
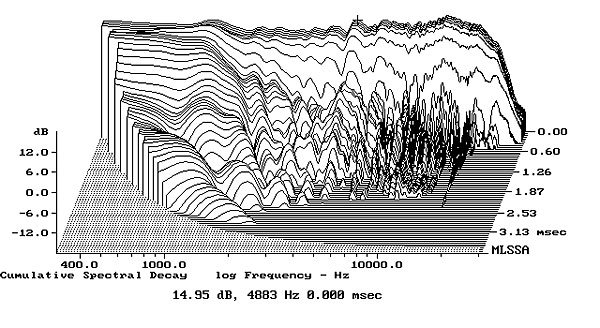
Fig.6 JBL XPL-160, cumulative spectral-decay plot on tweeter axis at 50" (0.15ms risetime).
NEXT: Specifications »
|
|
| ||||||||||
- Log in or register to post comments


| Loudspeakers Amplification Digital Sources | Analog Sources Accessories Featured | Music Columns Retired Columns | Show Reports | Features Latest News Community | Resources Subscriptions |
 © 2024 Stereophile
AVTech Media Americas Inc., USA
All rights reserved

