| Columns Retired Columns & Blogs |
Hyperion HT-88 monoblock power amplifier Measurements
Sidebar 3: Measurements
I used Audio Precision's top-of-the-line SYS2722 system (see the January 2008 "As We See It" and www.ap.com) to examine the Hyperion's measured behavior; for some tests, I also used my vintage Audio Precision System One Dual Domain.
Art Dudley had been bothered by high levels of hum from two of the samples he'd been sent by Hyperion. He therefore broke off his auditioning to send me all three samples of the HT-88, so that I could try to track down the problem. I performed a complete set of measurements on all three amplifiers; in the end, I found a problem in only one sample, serial no. HP-4022810. It worked fine for about an hour, then suddenly developed 12V of 60Hz hum on the output terminals. The other two samples checked out fine, even after being left on overnight so I returned them to AD so he could finish the review.
Voltage gain at 1kHz varied depending on the output-transformer tap and also on the sample. One of the hum-free samples and the hummy sample (before it started humming) offered a modest 20.5dB from the 4 ohm tap, 22.6dB from the 8 ohm tap, and 23.7dB from the 16 ohm tap. The other hum-free sample's figures were all 0.5dB lower. Perhaps because of the low gain, the HT-88 is a quiet amplifier. The unweighted wideband signal/noise ratio from the 4 ohm tap (ref. 1W into 8 ohms) varied from a reasonably good 77.2dB (HP-404022809) to 86.2dB (HP-4022719), with the 8-ohm tap a couple of dB worse and the 16-ohm tap a couple of dB more than that. A-weighting the measurement resulted in excellent figures of 100.7dB from the 4 ohm tap, 98.4dB from the 8 ohm tap, and 96.8dB from the 16 ohm tap. (Both hum-free samples gave the same A-weighted figures.)
Input polarity was preserved; ie, the amplifier was non-inverting. The input impedance of all three samples was very high at >200k ohms across the audioband, meaning that it will not load down the preamplifier at all.
The output impedance depended on the transformer tap, but was consistent across all three samples. From the 4 ohm tap, it was a moderately high 1.6 ohms at low frequencies and 1.5 ohms at middle frequencies, but rose precipitously to 6 ohms at 20kHz. From the 8 ohm tap it was 2.9 ohms at low frequencies, 2.6 ohms in the midrange, and 3.2 ohms at 20kHz. From the 16 ohm tap the figures were 5.7 ohms, 5.25 ohms, and 6 ohms, respectively. The HT-88's frequency response will therefore vary more than usual, depending on how the loudspeaker's impedance changes with frequency. The black trace in fig.1, for example, shows the response from the 8 ohm tap into our standard simulated loudspeaker. It suffers from ±1.5dB variation, which will be audible. These variations reached ±2.5dB from the 16 ohm tap, but decreased slightly to ±1.2dB from the 4 ohm tap (fig.2). However, the large increase in output impedance at high frequencies from this tap superimposes a significant top-octave rolloff on all the traces in this graph, ranging from –1dB at 20kHz into 16 ohms (cyan trace) through –3dB at 20kHz into 8 ohms (blue), –5.8dB at 20kHz into 4 ohms (red), and –8.4dB at 20kHz into 2 ohms (magenta). From the 8 ohm tap (fig.1) and the 16 ohm tap (not shown), the response was maintained to almost 20kHz into all loads greater than 2 ohms.
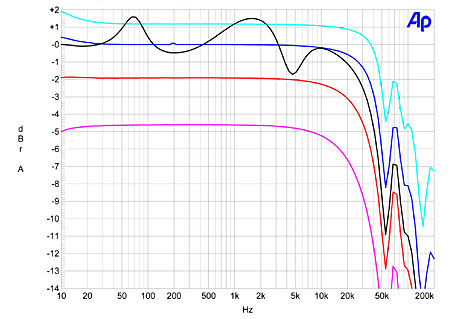
Fig.1 Hyperion HT-88, 8 ohm tap, frequency response at 2.83V into: 16 ohms (cyan), 8 ohms (blue), 4 ohms (red), 2 ohms (magenta), simulated loudspeaker load (black). (1dB/vertical div.)

Fig.2 Hyperion HT-88, 4 ohm tap, frequency response at 2.83V into: 16 ohms (cyan), 8 ohms (blue), 4 ohms (red), 2 ohms (magenta), simulated loudspeaker load (black). (1dB/vertical div.)
While there was evidence of an output-transformer resonance at 70kHz in the 8 ohm behavior (fig.1), this resonance moved up in frequency to around 110kHz from the 4 ohm tap (fig.2), but was very much higher in amplitude. As a result, 1kHz and 10kHz squarewaves measured at the 8 ohm tap into 8 ohms (figs. 3 and 4) showed a slight amount of overshoot and ringing, superimposed on a good square waveform; a 10kHz squarewave measured at the 4 ohm tap into 8 ohms showed a significant amount of ultrasonic ringing overlaying a long risetime (fig.5).

Fig.3 Hyperion HT-88, 8 ohm tap, small-signal 1kHz squarewave into 8 ohms.

Fig.4 Hyperion HT-88, 8 ohm tap, small-signal 10kHz squarewave into 8 ohms.

Fig.5 Hyperion HT-88, 4 ohm tap, small-signal 10kHz squarewave into 8 ohms.
Even with its paralleled pair of KT-88 tubes, the Hyperion's single-ended design is not going to generate gobs of power. The manufacturer specifies the maximum power as 18W, presumably with the output-transformer tap matched to the load; fig.6 shows how the THD+noise percentage changes as the output power increases under that condition. Even at 10mW, the THD is (just) above 0.1%, and, as happens with the "bent" transfer function of a single-ended output stage, it rises linearly with increasing power. Our normal definition of "clipping" is 1% THD+N; the HT-88 is outputting just 800mW at that level, although the waveform on the 'scope screen was not clipped so much as asymmetrically distorted. At 3% THD the Hyperion is giving 6W, above which the waveform does start to visibly clip. However, even at 10% THD, the HT-88 still doesn't quite meet its 18W (12.55dBW) specification, giving 16W (12dBW). Fig.7 shows how the amplifier's THD+N percentage present in the 4 ohm tap changes with output power into loads ranging from 2 to 16 ohms. The maximum power is obtained when the load matches the tap, but the lowest distortion is obtained when the load is higher than the nominal tap value.

Fig.6 Hyperion HT-88, distortion (%) vs 1kHz continuous output power into (from bottom to top at 5W): 16 ohm tap into 16 ohms, 8 ohm tap into 8 ohms, 4 ohm tap into 4 ohms.

Fig.7 Hyperion HT-88, 4 ohm tap, distortion (%) vs 1kHz continuous output power into (from bottom to top at 5W): 4, 16, 8, 2 ohms.
This can also be seen in fig.8, the plot of the Hyperion amplifier's THD+N against frequency from its 8 ohm tap at a moderate level (1.5V) into 2 ohms (cyan trace), 4 ohms (magenta), 8 ohms (red), and 16 ohms (blue). The picture was similar from the 4 and 16 ohm taps (not shown), but what is more important than the absolute level of the distortion is its spectral content. Fig.9 reveals that it is almost pure second harmonic, which, all things being equal, sounds relatively innocuous. In fact, there is some evidence that people prefer the sound with a little additional second-harmonic content, finding it "fatter" and "warmer." There is some third harmonic present (fig.10), but this is 20dB below the level of the second, while higher-order harmonics are very low in level. Surprisingly, other than producing a high level of second-order difference component at –46dB (2%), the HT-88 did well on the high-frequency intermodulation test (fig.11), provided the load impedance was higher than the output transformer tap.

Fig.8 Hyperion HT-88, 8 ohm tap, THD+N (%) vs frequency at 1.5V into: 16 ohms (blue), 8 ohms (red), 4 ohms (magenta), 2 ohms (cyan).

Fig.9 Hyperion HT-88, 4 ohm tap, 1kHz waveform at 300mW into 8 ohms (top), 0.5% THD+N; distortion and noise waveform with fundamental notched out (bottom, not to scale).

Fig.10 Hyperion HT-88, 4 ohm tap, spectrum of 50Hz sinewave, DC–1kHz, at 1W into 8 ohms (linear frequency scale).

Fig.11 Hyperion HT-88, 4 ohm tap, HF intermodulation spectrum, DC–24kHz, 19+20kHz at 1W peak into 4 ohms (linear frequency scale).
Pretty much all of the Hyperion HT-88's anomalous behavior on the test bench stems from its single-ended output stage, which acts as a second-harmonic generator. This is inescapable, and with that in mind, the HT-88 actually measures quite well for its type. It is also extremely well made, bearing in mind the fact that one of the samples developed intolerable hum.—John Atkinson
|
| ||||||||||
- Log in or register to post comments


| Loudspeakers Amplification Digital Sources | Analog Sources Accessories Featured | Music Columns Retired Columns | Show Reports | Features Latest News Community | Resources Subscriptions |
 © 2024 Stereophile
AVTech Media Americas Inc., USA
All rights reserved

