| Columns Retired Columns & Blogs |
Genesis Technologies Genesis III loudspeaker Measurements
Sidebar 3: Measurements
Though John Atkinson carried out the following measurements, I saw the results only after completing my auditioning. JA experimented with the controls and found the flattest measured on-axis response with the tweeter control at 9 o'clock, the upper-midrange control at maximum, and the lower-midrange control at the flat position. He also measured the III with the rear-panel level controls at the positions set by Arnie Nudell for the Stereophile listening room when he brought the III to Santa Fe for review. For auditioning in my listening room, I used slightly different settings.
The III had a measured sensitivity of 86.5dB/W/m (using "B"-weighted noise), an insignificant half a dB lower than the specified 87dB. The III's impedance magnitude and phase angle are shown in fig.1. This measurement was made with our Audio Precision System One, with the III's mid and treble controls set to their maximum and minimum settings and the lower-mid set to 12 o'clock. (The cursor, showing a value of 4 ohms at 4.3kHz, is set on the curve with the controls turned down to their minimums.) The impedance is very low over most of the audio range, staying below 4 ohms between 17Hz and 700Hz. The minimum impedance was a very low 1.2 ohms (at 38Hz), this presumably due to the shunt inductor in the woofer feed. There is also a second dip to 2 ohms (or below, depending on the control settings) at 300Hz. The gradual rise in impedance below the 38Hz minimum is due to the series capacitor in the woofer circuit. Note that there is no impedance peak at the sealed-box tuning frequency: it has been removed by the LC network in the woofer circuit. Overall, the III's lowish overall impedance and dip to 1.2 ohms suggest it is a demanding load on a power amplifier. Considering the impedance curve, I am surprised that the VTL 225W monoblocks drove the IIIs as well as they did.
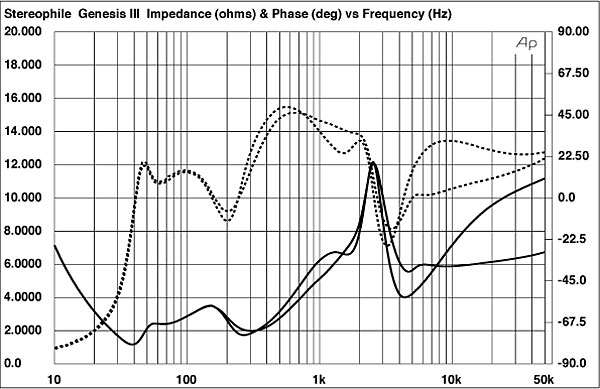
Fig.1 Genesis III, electrical impedance (solid) and phase (dashed) with tone controls set to maximum and minimum positions. Cursor at 4.3kHz lies on the impedance with control at minimum posiion (2 ohms/vertical div.).
Fig.2 is the III's FFT-derived response averaged over a 30° lateral window measured on the tweeter axis. The woofers' nearfield response, measured separately, has been appended to the curve. The top curve is with the driver level controls set for flattest response, the lower curve at the position Nudell set them for auditioning in the Stereophile listening room. The most prominent feature is the rising bass, likely the result of the two woofers' outputs combining below 70Hz. This correlated closely with my impressions of too much bass below 100Hz. The –6dB point is 28Hz, and the rolloff is at about 24dB/octave, suggesting good subjective bass extension. The two midband suckouts at 400Hz and 700Hz may be due to interference between the two midrange drivers on the tweeter axis at the necessarily close (45") measuring distance JA used. Nevertheless, as we'll see later in the vertical-response family of curves, these suckouts fill in above the tweeter axis and below the lower-midrange axis.
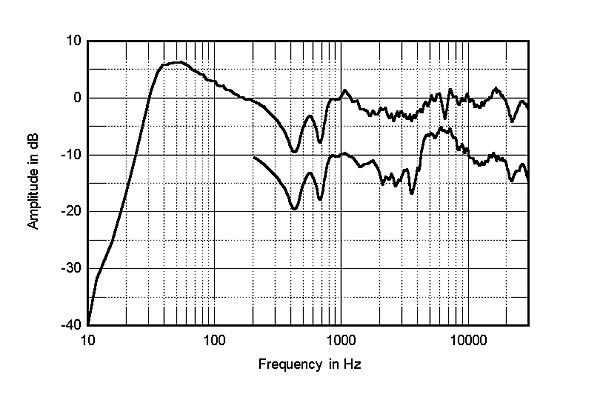
Fig.2 Genesis III, anechoic response on tweeter axis at 45", averaged across 30° horizontal window and corrected for microphone response, with tone controls set for flat response (top) and set by Arnie Nudell (bottom), with complex sum of nearfield responses plotted below 312Hz.
The overall response, however, is quite flat, with a slight tendency toward a rising upper midrange and treble. Before seeing the response curves, I had guessed that the treble may have been slightly rolled off. The extremely clean treble provided by the III's 1" ribbon tweeter no doubt created this impression: When treble hash and grunge are removed, it sounds as though there is less energy. Moreover, when pointed straight ahead (no toe-in), the top-octave treble level will be slightly reduced by the tweeter's horizontal off-axis rolloff seen in the next graph.
The Genesis III's horizontal family of responses on the tweeter axis is shown in fig.3. This plot shows the difference between the on-axis response and the off-axis response, measured at 15° (second trace down) to 90° off-axis (bottom trace). These curves indicate how the sound will change at different horizontal angles. At 15°, the III had virtually the same response as on-axis—excellent performance. Even when measured far off-axis, the III had very flat response to about 7kHz. Again, this is excellent performance. These measurements suggest that sidewall reflections of the speaker's output will have a similar energy distribution to the direct sound, resulting in low coloration at the listening position. Note, however, that the tweeter's dispersion is good to about 30°, but rolls off rapidly thereafter. The III's high-treble balance will therefore be dependent on the amount of toe-in; the flattest response is achieved with the listener sitting slightly off-axis (the loudspeakers pointed straight ahead). Further, rooms with reflective sidewalls will probably not sound overly bright, as they would with a loudspeaker with a flatter off-axis response in the high treble.
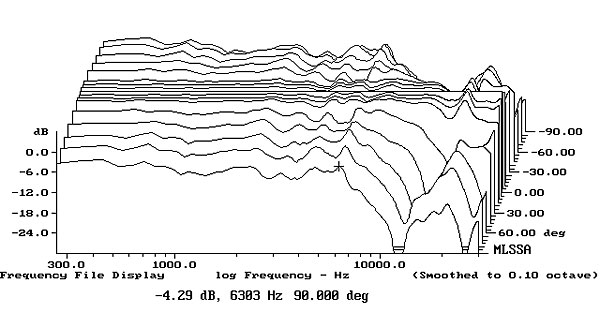
Fig.3 Genesis III, lateral response family, normalized to response on tweeter axis (from top to bottom): differences in response 5–45° off-axis; reference response; differences 5–45° off-axis.
Fig.4 is the Genesis III's vertical family of response curves. These curves show the differences in response as a function of vertical axis. The two top curves, measured above the tweeter axis, show big peaks in the upper midrange and treble; don't listen to the IIIs standing up. The lower traces show fairly large differences in response with height. Measuring the five-way III at such a close distance (45") may account for these large balance shifts. Sitting farther away from the III should produce less change in balance as a function of listening axis than shown here. Note also that the tweeter's HF rolloff in the vertical plane parallels its rolloff in the horizontal plane—unusual for a ribbon. Rectangular ribbons typically have very limited vertical dispersion, a factor overcome by the III's planar transducer being round.
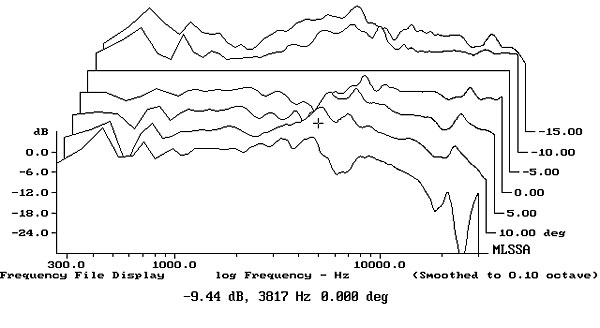
Fig.4 Genesis III, vertical response family, normalized to response on tweeter axis (from top to bottom): differences in response 5–10° above axis; reference response; differences 5–20° below axis.
Looking at the response of the individual drivers as measured in the nearfield (fig.5), we can see how the two woofers overlap below 70Hz, with the lower woofer (red) trace) rolling off sooner than the upper woofer (black). The two woofers reproducing the same range will combine to produce more energy where they overlap—exactly what I heard in the auditioning. The ultimate LF rolloff is about 24dB/octave, a result of the 12dB/octave rolloff of the sealed enclosure being modified by the LC network's additional 12dB/octave rolloff. The two midrange drive-units are shown separately, and the way the midrange is shared between them can be easily seen.
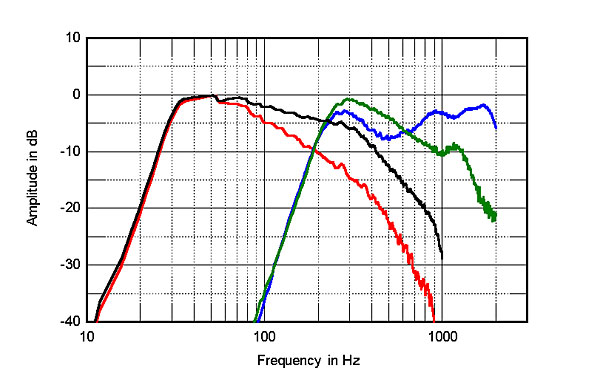
Fig.5 Genesis III, individual nearfield responses of lower woofer (red), upper woofer (black), lower midrange unit (green), and upper midrange unit (blue).
JA also measured the III's response in my listening room at the listening position. Five measurements, taken at different microphone positions around my listening chair, were averaged to produce the plot of fig.6. Note the excessive bass below 100Hz, peaking in-room at 65Hz. There is also a slight treble rolloff, seen as the gently sloping trace above 7kHz. Although not a reliable guide in how a loudspeaker sounds, these in-room measurements do correlate with my listening impressions.
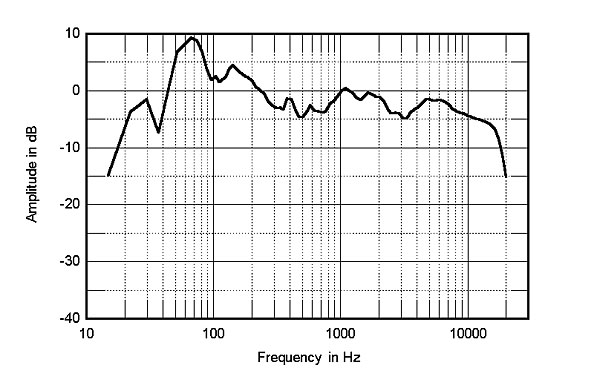
Fig.6 Genesis III, spatially averaged, 1/3-octave response in RH's listening room, centered on the listening seat.
The III's impulse response, measured both on the tweeter axis (43" from the ground) and my listening axis (37" from the ground), is shown in figs.7 & 8. The slightly slow rise time in the latter graph is due to the midrange drivers being time-coincident with the tweeter on this axis. This can be more clearly seen in the step responses calculated from the impulse responses (figs.9 & 10, respectively). The initial spike in fig.9 is the tweeter, followed by the midranges and woofers. (A perfect step response—which doesn't exist in loudspeakers—would produce a right-triangle–shaped plot.) There is better time coherence between the upper midrange dome and the tweeter in fig.10. Note also that there is none of the typical metal-dome tweeter ringing seen in most impulse responses in any of the Genesis's time plots. The individual impulse responses show that, like the tweeter, the two woofers and two midrange drivers are all connected with positive polarity.
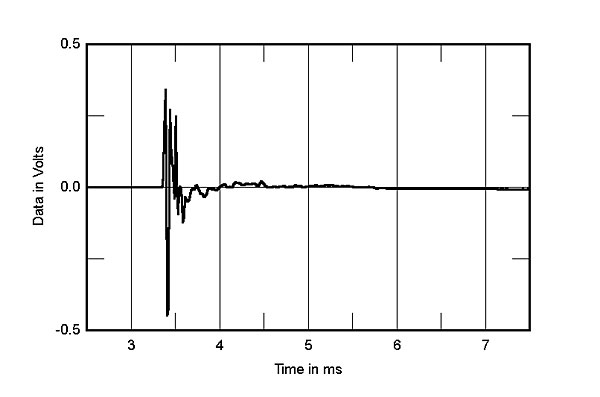
Fig.7 Genesis III, impulse response on HF axis at 45" (5ms time window, 30kHz bandwidth).
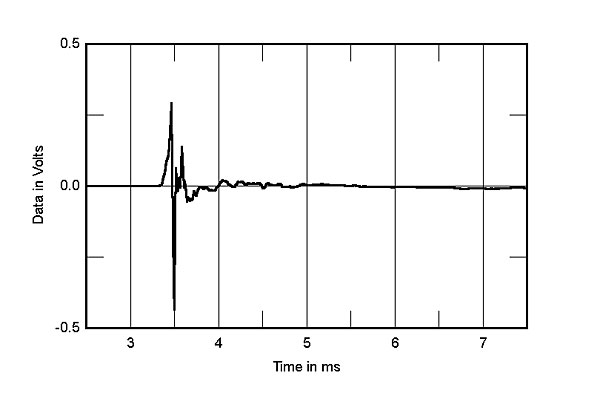
Fig.8 Genesis III, impulse response on listening axis at 45" (5ms time window, 30kHz bandwidth).
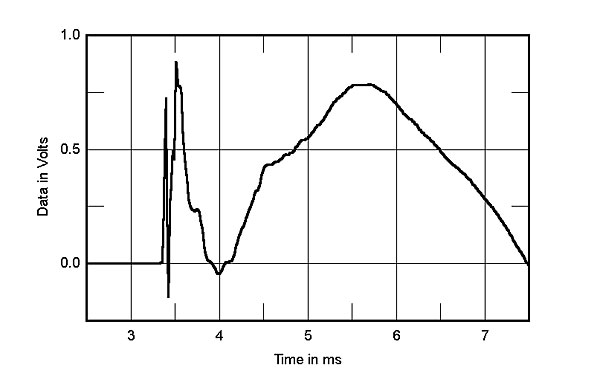
Fig.9 Genesis III, step response on HF axis at 45" (5ms time window, 30kHz bandwidth).
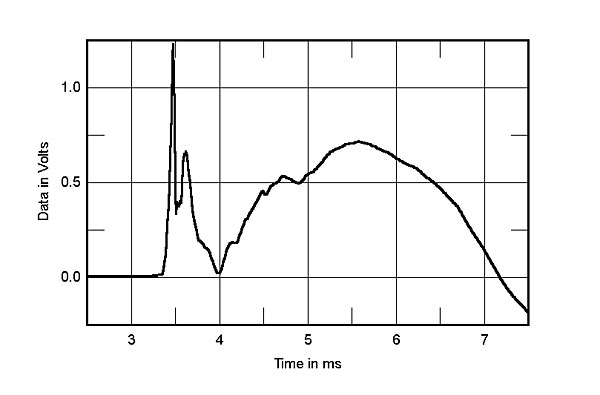
Fig.10 Genesis III, step response on listening axis at 45" (5ms time window, 30kHz bandwidth).
Fig.11 is the III's cumulative spectral-decay, or "waterfall," plot made with the rear-panel level controls set for flattest response and measured on the tweeter axis. The decay is quick and clean, particularly above 7kHz. A few resonant modes are visible, but these are well down in level. The up-tilted treble balance will flatten out when the listener sits between the IIIs with no toe-in.
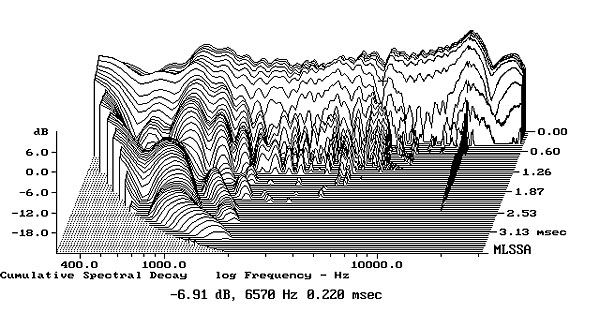
Fig.11 Genesis III, cumulative spectral-decay plot at 45" (0.15ms risetime).
Finally, driving the III with a sinewave oscillator revealed that the enclosure was very inert. There were two frequencies at which I could feel the cabinet vibrating (65Hz and 160Hz), but not severely. The resonance modes tended to be well-damped and evenly distributed. The Listening Room Diagnostic Recording (LEDR) on the first Chesky Test CD was only moderately well-reproduced. The "Up" test didn't produce much impression of height, and the "Over" test had some discontinuities.—Robert Harley
|
| ||||||||||
- Log in or register to post comments


| Loudspeakers Amplification Digital Sources | Analog Sources Accessories Featured | Music Columns Retired Columns | Show Reports | Features Latest News Community | Resources Subscriptions |
 © 2024 Stereophile
AVTech Media Americas Inc., USA
All rights reserved

