| Columns Retired Columns & Blogs |
Fisher 500-C vintage stereo receiver Measurements
Sidebar 4: Measurements
A factor that must be taken into consideration when reviewing a piece of vintage gear is the provenance of the samples tested. The Fisher 500-C Peter Breuninger sent me for measurement was serial number 58022S, and it varied from original condition in the manner described by PB in the "Reviewing & Testing Vintage Audio Components" sidebar. Peter had fixed high-quality brass speaker terminal adapters to the 8 ohm output screw connectors; I performed all the tests using this transformer tap.
After plugging in the four Electro Harmonix 7591A output tubes (one of these tubes was physically larger than the other three), I looked first at the receiver's performance through its Aux input. The 500-C didn't invert signal polarity and offered a maximum of 38.4dB voltage gain into 8 ohms at 1kHz. The input impedance, specified at 100k ohms, was actually higher than this, at 180k ohms at 20Hz, more than 470k ohms at 1kHz, and 300k ohms at 20kHz. As a result, the receiver won't load down source components. According to the 500-C circuit diagram I found on the Web, the active tone-control circuitry precedes the volume control, so I was concerned about input overload with modern CD players, which offer a much higher output than the tape recorders the 500-C would have originally been used with. However, with the tone controls set to their flat, central positions, a 2V input at 1kHz was handled without additional distortion.
The receiver's output impedance was, as expected, on the high side, at around 2 ohms in the bass and midrange, rising to 9.3 ohms at 20kHz. As a result, the modification of the 500-C's frequency response, due to the usual Ohm's Law interaction between the source and load impedances, was relatively large, at ±1.6dB (fig.1, top trace at 1kHz), which will be easily audible.
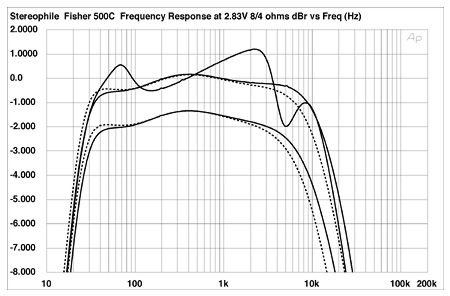
Fig.1 Fisher 500-C, volume control set to 12:00, Aux input frequency response at 2.83V into (from top to bottom at 2kHz): simulated loudspeaker load, 8 ohms, 4 ohms (1dB/vertical div., right channel dashed).
Also shown in this graph are the small-signal frequency responses into 8 and 4 ohm resistive loads with the tone controls set to "0" and the volume control set at 12:00. Note the excellent channel balance at this volume-control setting. However, the control tracking worsened at high and low settings, with more than 1dB channel imbalance evident at both extremes. Even with the high-pass filter out-of-circuit, the bass rolls off sharply below 35Hz. At the other end of the spectrum, the receiver suffers from a drastic lack of top-octave energy, the response being 5dB down at 20kHz into 8 ohms, and even more into 4 ohms. (This behavior didn't change at different volume-control settings.) No wonder Wes Phillips found the Sonus Faber Cremonas not to sparkle in the manner he is used to.
As a result of this limited bandwidth, the 500-C's reproduction of a 10kHz squarewave (fig.2) showed long risetimes and a rounded-off shape. To my surprise, though a 1kHz squarewave was reproduced with a squarer shape (fig.3), this was accompanied by a small amount of overshoot, suggesting the presence of a parasitic high-frequency resonance somewhere in the circuit. This overshoot was well damped, however, and may have no subjective consequences.
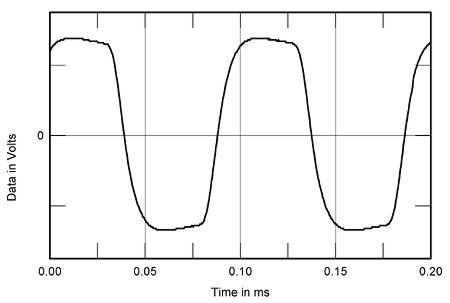
Fig.2 Fisher 500-C, small-signal 10kHz squarewave into 8 ohms.
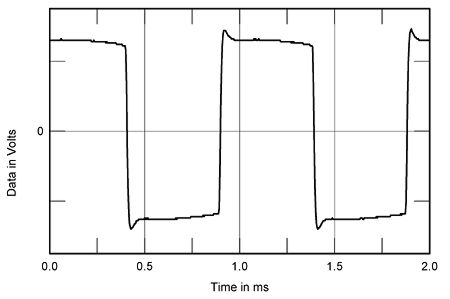
Fig.3 Fisher 500-C, small-signal 1kHz squarewave into 8 ohms.
Fig.4 shows the effects of the treble and bass tone controls when set to their maximum, minimum, and central positions. These basically offer up to ±10dB of boost and cut at 60Hz and 11kHz—way more than would be required in normal use—with minimal interaction between them. Channel separation via the Aux input (fig.5) was modest, with the usual capacitive coupling (probably at the volume potentiometer, or in the tone-control circuit, which shares a pair of 12AX7 tubes between the channels) reducing high-frequency separation with a 6dB/octave slope. Though the separation reaches better than 70dB in the upper bass, it decreases at lower frequencies, presumably due to a higher-than-optimal power-supply impedance in this region. The signal/noise ratio (ref. 1W into 8 ohms with the input shorted and the volume control set to its maximum) was good, at 63.7dB, wideband, unweighted. This improved to 72.8dB, unweighted, 22Hz–22kHz; and 85.9dB, A-weighted.
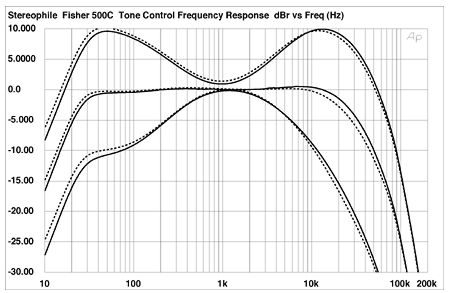
Fig.4 Fisher 500-C, volume control set to 12:00, effect of treble and bass controls set to their maximum, minimum, and neutral positions (5dB/vertical div., right channel dashed).
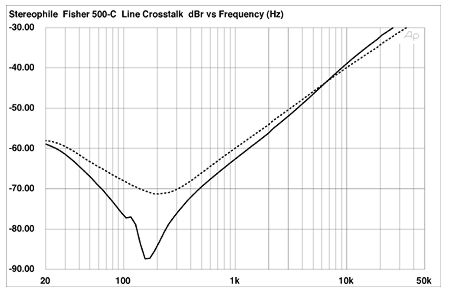
Fig.5 Fisher 500-C, Aux input channel separation (10dB/vertical div., R–L dashed).
With its pair of 7591A output tubes per channel, the 500-C offers a reasonable amount of power, provided the load is close to the nominal value of the output transformer tap. Fig.6 plots the receiver's THD+noise percentage against output power into 4, 8, and 16 ohms. (I couldn't measure the power into 2 ohms because the output tube plates started to glow cherry red at anything above 1W or so.) With clipping defined as 1% THD+N, the 500-C clips at 36W into 8 ohms (15.6dBW), 26W into 16 ohms (11.1dBW), but only 6W into 4 ohms (1.75dBW).
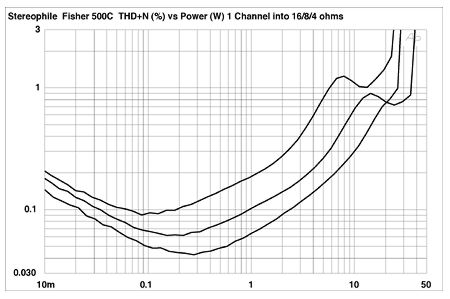
Fig.6 Fisher 500-C, distortion (%)vs 1kHz continuous output power with one channel driven into (from bottom to top at 1W): 16 ohms, 8 ohms, 4 ohms.
Perhaps due to output-stage biasing differences, the channels differed considerably when it came to their small-signal linearity—which makes saying which is typical of the original design fraught with difficulty. Fig.7 plots THD+noise against frequency at 2.83V into 16, 8, and 4 ohms. The right channel (dashed traces) is significantly more linear than the left in the midrange, but significantly less so at low frequencies. The 500-C is clearly much happier driving higher impedances. Also, the peak at 40kHz in the THD traces again suggests the presence of a parasitic resonance at an ultrasonic frequency (at 80 or 120kHz).
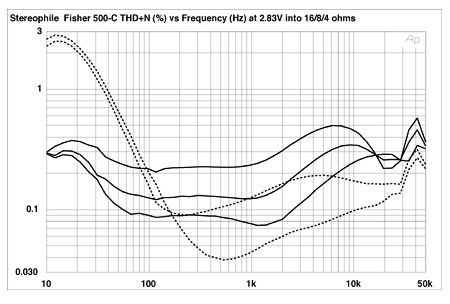
Fig.7 Fisher 500-C, THD+N (%)vs frequency at 2.83V into (from bottom to top): 16 ohms, 8 ohms, 4 ohms (right channel dashed).
The good news is that, into higher impedances, the spectrum of the distortion is predominantly the subjectively benign second harmonic at suitably low levels (figs.8–10). However, both odd- and higher-order harmonics appear into lower impedances (figs.11–13), particularly at low frequencies, this presumably due to the onset of output-transformer saturation (fig.11).
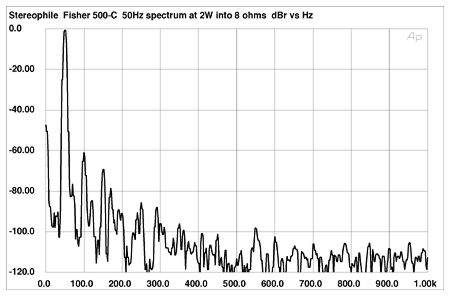
Fig.8 Fisher 500-C, spectrum of 50Hz sinewave, DC–1kHz, at 2W into 8 ohms (linear frequency scale).
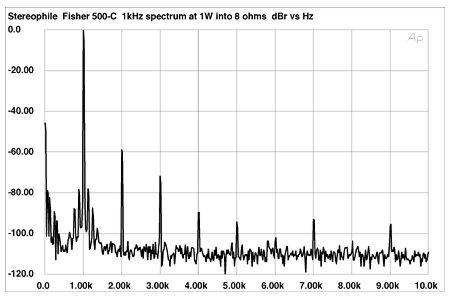
Fig.9 Fisher 500-C, spectrum of 1kHz sinewave, DC–1kHz, at 1W into 8 ohms (linear frequency scale).
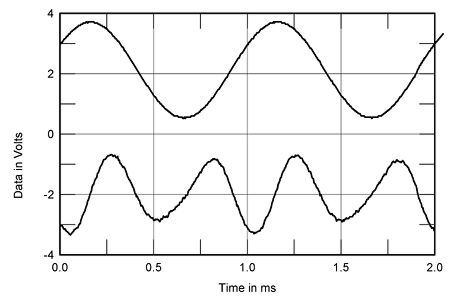
Fig.10 Fisher 500-C, 1kHz waveform at 0.65W into 16 ohms (top), 0.08% THD+N; distortion and noise waveform with fundamental notched out (bottom, not to scale).
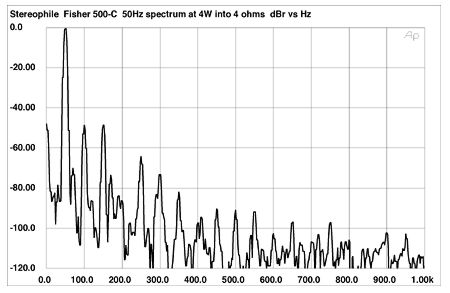
Fig.11 Fisher 500-C, spectrum of 50Hz sinewave, DC–1kHz, at 4W into 4 ohms (linear frequency scale).
Note the existence of ±120Hz sidebands in the 1kHz spectra (figs.9 and 12), again indicating a higher-than-optimum power-supply impedance. These sidebands can also be seen in the high-frequency intermodulation spectrum (fig.14), surrounding not only the 19kHz and 20kHz fundamentals but also the second- and third-order intermodulation products. Even at the modest power level at which this graph was taken, equivalent to a peak equivalent power of 13.2W into 8 ohms, the 500-C's output stage is having to work hard. However, even though the 18kHz and 21kHz products lie at –52dB (0.25%), the lower-frequency difference product at 1kHz lies at a low –70dB (0.03%) in this graph, suggesting that the 500-C will still sound sweet.
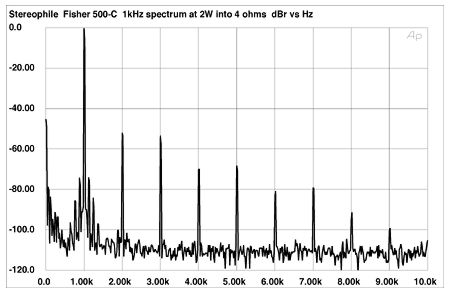
Fig.12 Fisher 500-C, spectrum of 1kHz sinewave, DC–1kHz, at 2W into 4 ohms (linear frequency scale).
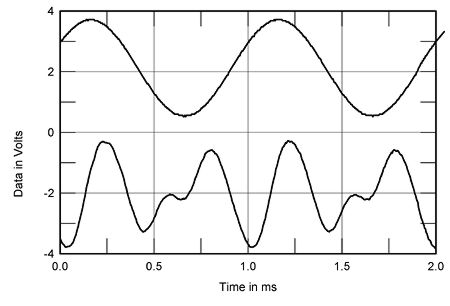
Fig.13 Fisher 500-C, 1kHz waveform at 1.8W into 4 ohms (top), 0.27% THD+N; distortion and noise waveform with fundamental notched out (bottom, not to scale).
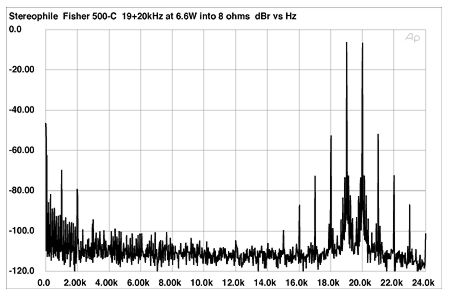
Fig.14 Fisher 500-C, HF intermodulation spectrum, DC–24kHz, 19+20kHz at 13.2W peak into 8 ohms (linear frequency scale).
Turning to the phono stage, it is appropriate to note that PB didn't audition this sample with LP sources. The phono stage is based on a single 12AX7 per channel, the two halves of this tube working in series to provide a measured 40.4dB of voltage gain at 1kHz, measured at the "reverb" output. The input impedance was 50k ohms at 1kHz, decreasing to 47k ohms at the frequency extremes, and the phono stage preserved absolute polarity. The A-weighted S/N ratio (ref. 5mV input at 1kHz) was a pretty good 60dB, though this worsened to 46dB when measured unweighted over a wide bandwidth of 10Hz–500kHz.
The accuracy of the RIAA de-emphasis is not to the standard routinely experienced four decades after the 500-C's introduction, featuring a serious lack of mid-treble energy or an excess of midrange energy, however you wish to look at it (fig.15). It is hard to assess the phono stage's linearity, the measurement being dominated by low-frequency noise. However, midband and treble THD are around the 0.1% level, which is good performance. However, THD rose to high levels below 100Hz, resulting in not just a lack of phono overload margin but a negative 2dB margin at 20Hz. At higher frequencies, the overload margins were more respectable, at 17.2dB at 1kHz and 16.2dB at 20kHz.

Fig.15 Fisher 500-C, phono input RIAA error (2dB/vertical div., right channel dashed).
The Fisher 500-C's measured performance needs to be put in the perspective of that of the sources and speakers in use back in the early 1960s. LPs didn't offer much in the way of low bass content, and although the master tapes may have had energy above 10kHz, it is debatable how much of that energy made its way onto disc and was reproduced by the phono cartridges of the day. Nor did loudspeakers—with such rare exceptions as the Quad ESL—have much to offer in the way of high-frequency extension. So what the 500-C has in the way of failings at the frequency extremes will not have mattered as much in 1965 as they might in 2005. I welcome feedback on this point, but the 500-C's lack of top-octave energy cannot be argued with. This is a "mellow"-sounding amplifier.
What is also not debatable is the receiver's output stage's lack of comfort with low-impedance loads. With modern tube designs, an 8 ohm output-transformer tap will still cope with a 4 ohm load without breaking too much of a sweat. By contrast, while the Fisher's 8 ohm tap will indeed deliver its maximum power into an 8 ohm load, this load is also the minimum that the receiver should see. The sample I measured offered respectable linearity into 8 and 16 ohms, but was perspiring into 4 ohms, and expiring into 2 ohms!
Within those limitations, and using CD as a source, the Fisher 500-C can be argued to be competitive with modern amplifiers. However, that can't be said for its phono stage, with its unflat RIAA equalization and inadequate LF overload margin. LP lovers are well advised to use an outboard phono stage to feed the 500-C's Aux input.—John Atkinson
- Log in or register to post comments

