| Columns Retired Columns & Blogs |
Nicely! done MF.
I have had the pleasure to seeing this gear in real time. Very much like a fine wristwatch or roaring sportscar, it is simply gorgeous.
I measured the Dan D'Agostino Master Audio Systems Momentum preamplifier in balanced mode using my top-of-the-line Audio Precision SYS2722 system (see www.ap.com and the January 2008 "As We See It"). The Momentum's maximum gain was a modest 8dB, which is fine—so many line preamplifiers offer way too much gain—and the preamp preserved absolute polarity (ie, was non-inverting), the front-panel meter glowing green. Pressing the Phase button on the remote control inverted polarity, and the meter now glowed pink. The input impedance was a usefully high 95k ohms at low and middle frequencies, dropping inconsequentially to 86k ohms at the top of the audioband. The output impedance was a low 79 ohms at all frequencies.
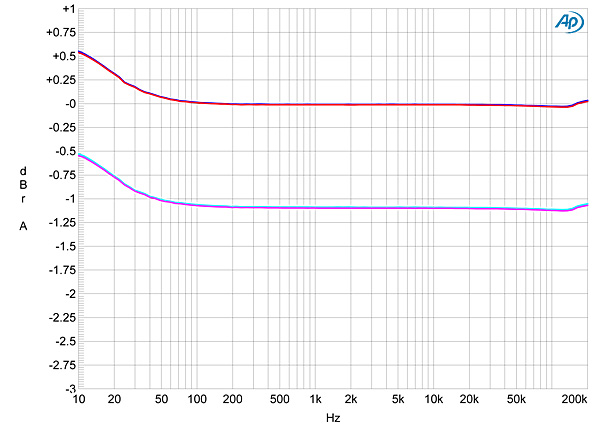
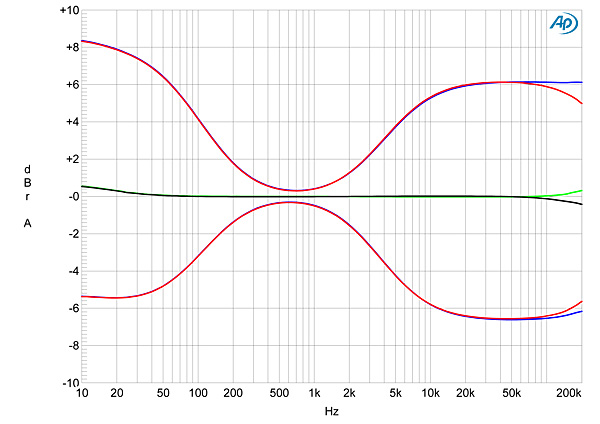
The Momentum's frequency response (fig.1) didn't change with load impedance, and was flat from 100Hz to >200kHz. Note the superb channel matching in this graph with the Balance centered. In the low bass, however, there was a slight rise in response, which reached +0.55dB at 10Hz. This graph was taken with the volume set to its maximum: "100" on the meter. The unity-gain position was just under "75" and, commendably, the frequency response was the same as at maximum volume. With the tone controls active but set to "0" (fig.2, green and gray traces), the audioband response was the same as it had been in fig.1, though now the right channel (gray trace) started to roll off above 150kHz. Set to their maximum and minimum positions, the bass and treble controls offered sensible amounts of boost and cut (blue and red traces).
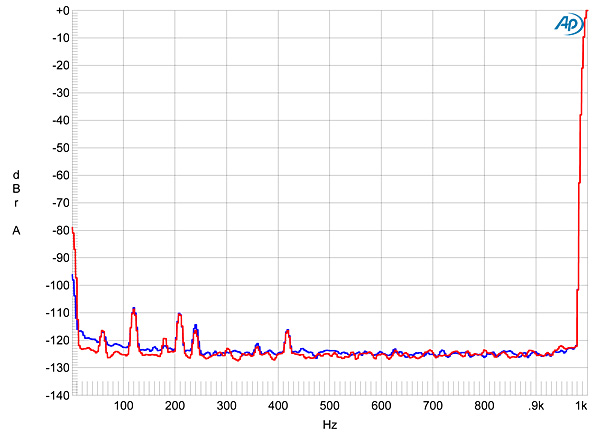
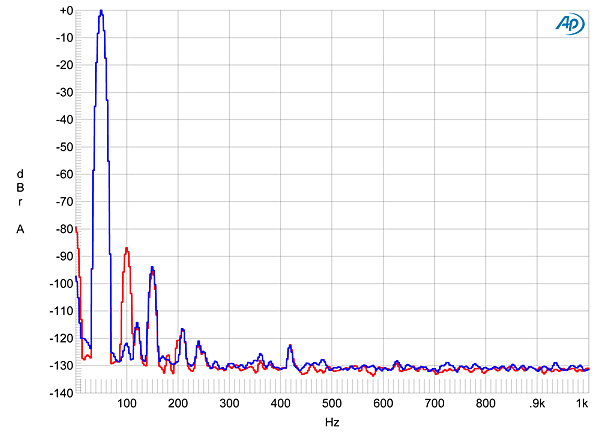
Channel separation was superb, at approximately 120dB at and below 500Hz and, at 20kHz, still 89dB R–L and 92dB L–R. As usual, I measure the signal/noise ratio in the worst-case condition: input shorted but volume control set to its maximum. The unweighted, wideband ratio, ref. 1V output, was 75.3dB in both channels, which improved to 92dB when the measurement bandwidth was restricted to the audioband. Switching an A-weighting filter into circuit improved this ratio by another 3dB. Fig.3 reveals the presence of extremely small amounts of 60, 120, 240, and 420Hz supply-related spuriae, with the highest in level, at 120Hz, lying just above –110dB below 1V, or 0.0003%. However, there is also a spurious tone at 210Hz, also at –110dB, that is not related to the power-supply frequency.
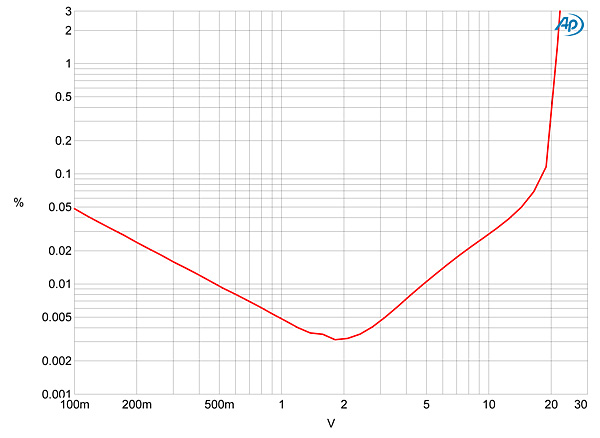
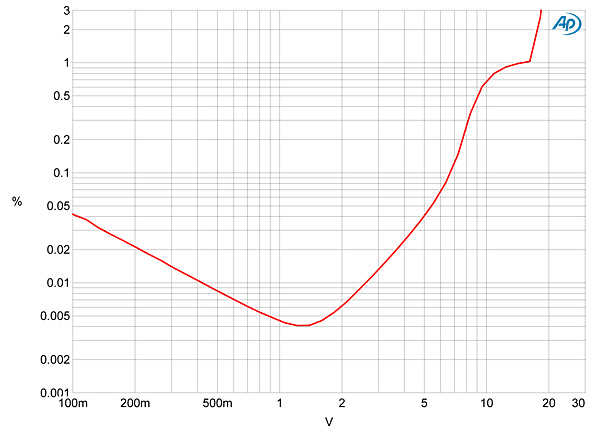
With our usual definition of clipping as 1% THD+noise, the D'Agostino preamplifier clipped at a whopping 21V into 100k ohms (fig.4). More significant, the distortion remained below the noise floor at levels below 2V, and was still just 0.007% at 4V, which will be about the highest level required to drive a typical power amplifier into clipping. With the Momentum driving the punishing 600 ohm load (fig.5), the clipping point dropped slightly, to 16V, but the distortion was still below the noise floor below 1.5V.
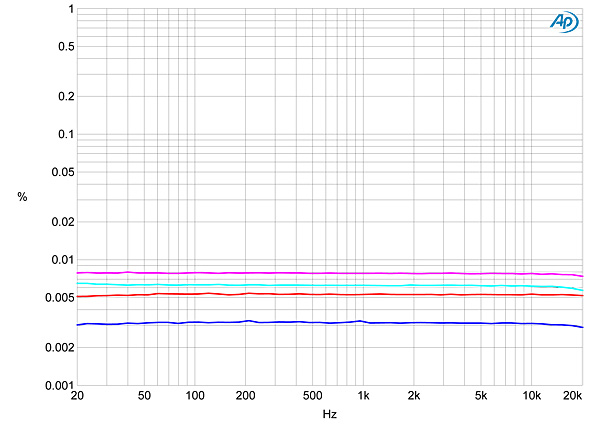
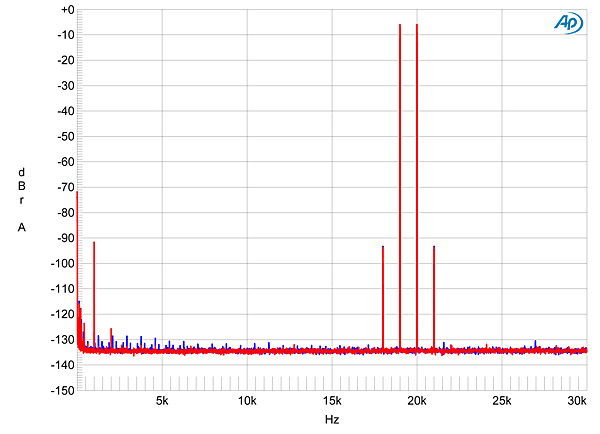
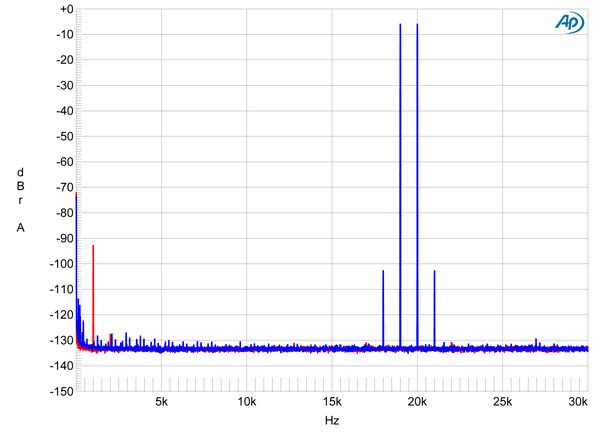
I measured how the percentage of THD+N varied with frequency at 2V, where figs. 4 and 5 indicated that I would be measuring distortion rather than noise. Even so, the percentage was commendably constant with frequency (fig.6). However, the right channel (red and magenta traces) was not quite as linear as the left (blue, cyan); fig.7 reveals that while the highest-level harmonic in the left channel was the third, with almost no second harmonic visible (blue), the right channel (red) had more second harmonic present than third. Intermodulation distortion was very low, even into 600 ohms with the right channel (fig.8, red trace), with the second-order difference product resulting from an equal mix of 19 and 20kHz tones lying below –90dB (0.003%). There was no intermodulation product at 1kHz with the left channel (fig.9, blue trace).
Its measured performance confirms that the Momentum preamplifier lives up to Dan D'Agostino's reputation for heroic audio engineering.—John Atkinson
|
| ||||||||||

Nicely! done MF.
I have had the pleasure to seeing this gear in real time. Very much like a fine wristwatch or roaring sportscar, it is simply gorgeous.

Great to know that wives only need five seconds to judge a piece of gear accurately. Mine does the same thing.


| Loudspeakers Amplification Digital Sources | Analog Sources Accessories Featured | Music Columns Retired Columns | Show Reports | Features Latest News Community | Resources Subscriptions |
 © 2024 Stereophile