| Columns Retired Columns & Blogs |
Classé Omega line-level preamplifier SIDEBAR 3: Measurements part 2
Referenced to these same input levels, the plot of THD+noise vs frequency is shown in fig.3—a very good result. The rise in the readings at higher frequencies reflects the high input voltage used (as above) to minimize the impact of noise on the result. (The input voltages were 2.15V balanced and 820mV unbalanced.) Fig.4 shows the THD+noise vs output voltage at 1kHz. The minimum points in the curves, just before the distortion starts to increase, are the output values used for the measurements plotted in figs.2 and 3.
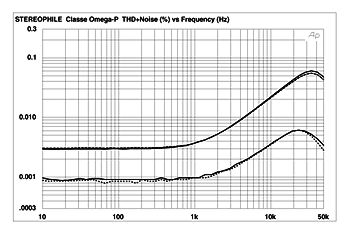
Fig.3 Classé Omega, THD+noise (%) vs frequency at 2.15V (balanced) and 820mV (unbalanced) into 100k ohms.
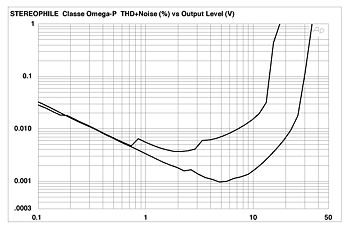
Fig.4 Classé Omega, distortion (%) vs output voltage into 100k ohms.
The spectrum of the Omega's output, driving a 50Hz sinewave at a very high output level of 10V into 100k ohms is shown in fig.5. The distortion is very low, with no artifacts above -95dB (about 0.002%).
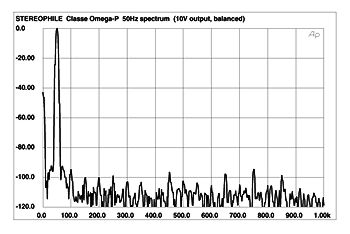
Fig.5 Classé Omega, spectrum of 50Hz sinewave, DC-1kHz, at 10V into 100k ohms (linear frequency scale).
Except for the measured gain—which will be sufficient for most systems but is still less than specified—the measurements taken of the Classé Omega indicate impeccable operation.—Thomas J. Norton
- Log in or register to post comments
