Columns Retired Columns & Blogs |
Chord Electronics Hugo TT D/A headphone amplifier Measurements
Sidebar 3: Measurements
Footnote 1: This test was suggested to me by Jürgen Reis, chief engineer of MBL.
I measured the Chord Hugo TT with my Audio Precision SYS2722 system (see www.ap.com and the January 2008 "As We See It"). Sources were S/PDIF on TosLink and coaxial from the SYS2722, and USB from my 2012 MacBook Pro running on battery power. (I didn't test the Bluetooth performance.) Macintosh's USB Prober utility reported the Chord's product string as "HugoTT" from "Chord Electronics Ltd," and confirmed that the USB port operated in the optimal isochronous asynchronous mode. Except where noted, all measurements were taken from the Chord's balanced outputs.
With the volume set to its maximum, the Hugo TT clipped with a 1kHz tone at 17dBFS from all of its outputs. The maximum output level was 5.85V from the balanced outputs, 4.78V from the unbalanced RCA jacks and headphone outputs. All three outputs preserved absolute polarity (ie, were non-inverting). (The XLR jacks are wired with pin 2 hot.) The output impedance from the RCA and headphone jacks was extremely low, <1 ohm at all audio frequencies, while the balanced outputs were sourced from just under 200 ohms, which is still usefully low.
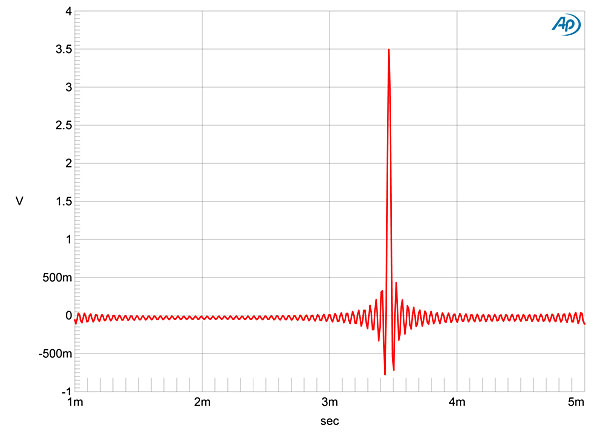
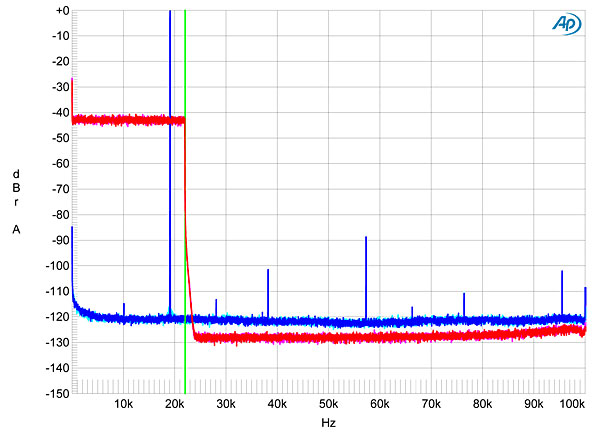
The Chord's impulse response with 44.1kHz-sampled data (fig.1) indicates that the digital reconstruction filter is a time-symmetrical FIR type, but with more taps than usual. (Compare this graph with the Parasound Halo's impulse response elsewhere in this issue.) Wideband spectral analysis of the Hugo TT's output while it decoded 44.1kHz-sampled white noise at 4dBFS (fig.2, red and magenta traces) reveals that the reconstruction filter rolls off rapidly above 22kHz and very quickly reaches the stopband, about 2kHz higher than the Nyquist frequency (half the sample rate, green vertical line).1 The aliasing product at 25kHz of a full-scale 19.1kHz tone (blue and cyan traces) is completely suppressed, and the harmonics of this tone all lie at or below 90dB.
Fig.1 Chord Hugo TT, impulse response at 44.1kHz (4ms time window).
Fig.2 Chord Hugo TT, wideband spectrum of white noise at 4dBFS (left channel red, right magenta) and 19.1kHz tone at 0dBFS (left blue, right cyan), with data sampled at 44.1kHz (20dB/vertical div.).
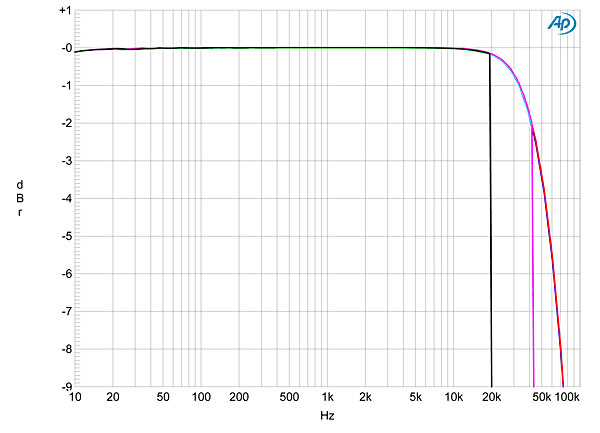
Fig.3 shows the frequency response of the Chord with data sampled at 44.1kHz (gray and green traces), 96kHz (cyan, magenta), and 192kHz (blue, red). The audioband response is perfectly flat, with no ripples, and the ultrasonic output sharply rolls off close to the lower two Nyquist frequencies. At the 192kHz rate, the rolloff continues the 96kHz characteristic, reaching 7dB at 70kHz. When I measured the response with 384kHz-sampled data via USB, the ultrasonic rolloff was basically identical to that with 192kHz data below 100kHz, and reached 29dB at 120kHz rather than closer to the 192kHz Nyquist frequency. This very probably doesn't matter. Channel separation with Crossfeed disabled (not shown) was superb, at >115dB below 1kHz, and still 96dB (LR) and 100dB (RL) at 20kHz.
Fig.3 Chord Hugo TT, frequency response at 12dBFS into 100k ohms with data sampled at: 44.1kHz (left channel green, right gray), 96kHz (left cyan, right magenta), 192kHz (left blue, right red) (1dB/vertical div.).
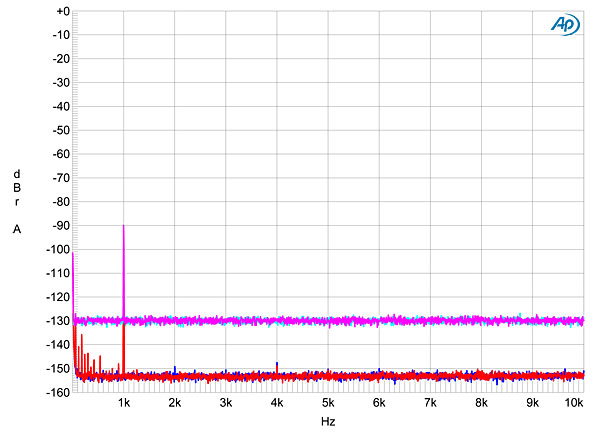
The Chord excelled with my usual test for resolution, in which I feed the device under test a dithered 1kHz tone at 90dBFS with first 16- and then 24-bit data. The cyan and magenta traces in fig.4 were taken with 16-bit data. The spectral line that represents the 1kHz tone peaks at exactly 90dBFS, implying negligible linearity error, and the noise floor is actually that of the dither used to encode the signal. With 24-bit data (blue and red traces), the noise floor drops by around 24dBin fact, I've had to expand the vertical scale of this graph to 160dB to show the traceswhich indicates that the Chord has at least 20-bit resolutionone of the best I have measured. This graph was taken with S/PDIF data; repeating it with USB gave an identical result, revealing that the Chord correctly handles high-resolution data via USB.
Fig.4 Chord Hugo TT, spectrum with noise and spuriae of dithered 1kHz tone at 90dBFS with: 16-bit data (left channel cyan, right magenta), 24-bit data (left blue, right red) (20dB/vertical div.).
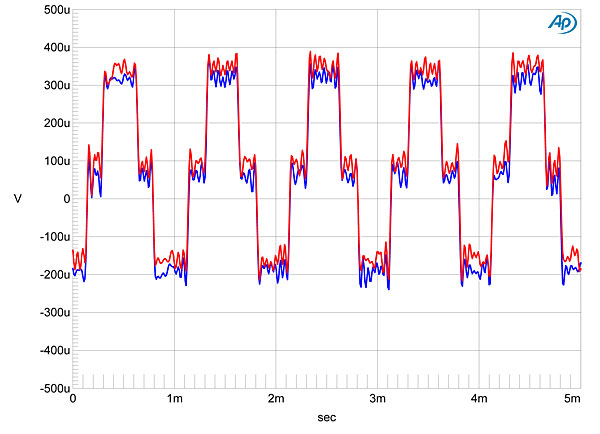
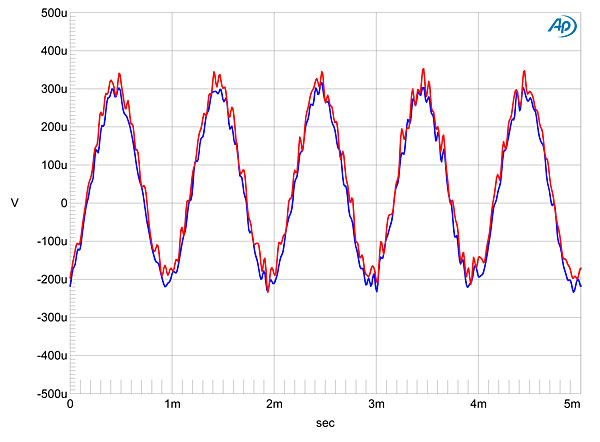
With an undithered 16-bit tone at exactly 90.31dBFS (fig.5), the high resolution and low level of analog noise allowed the three DC voltage levels described by this signal to be readily resolved, although there is about 60µV of positive DC offset visible in this graph. However, this will be inconsequential. With undithered 24-bit data at 90dBFS, the result was a well-formed sinewave (not shown).
Fig.5 Chord Hugo TT, waveform of undithered 1kHz sinewave at 90.31dBFS, 16-bit data (left channel blue, right red).
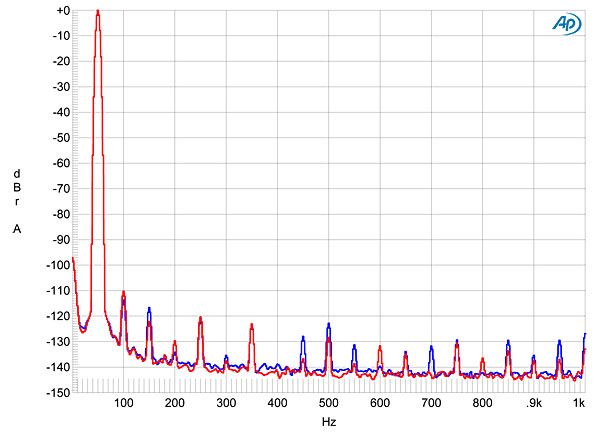
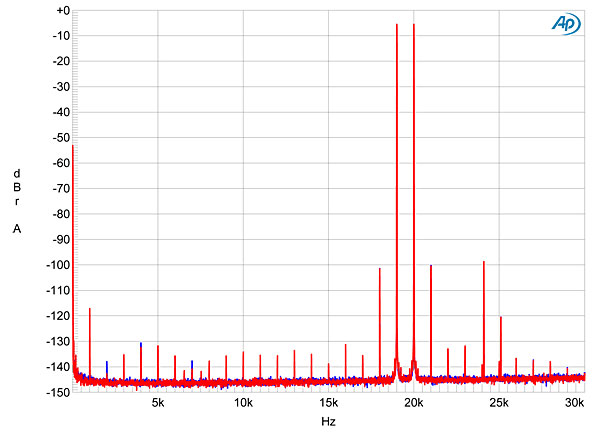
As suggested by fig.2, the Hugo TT offered extremely low levels of harmonic distortion. Fig.6 shows the spectrum of the balanced output driving a full-scale 50Hz tone into 100k ohms. The highest-level harmonic is the second, at just 110dB (0.0003%). Dropping the load to 600 ohms didn't affect the level of second-harmonic distortion, and though the third harmonic rose to 104dB (0.0006%), this is still extremely low. Intermodulation distortion, even into 600 ohms, was also very low (fig.7).
Fig.6 Chord Hugo TT, waveform of undithered 1kHz sinewave at 90.31dBFS, 24-bit data (left channel blue, right red).
Fig.7 Chord Hugo TT, spectrum of 50Hz sinewave, DC1kHz, at 0dBFS into 100k ohms (left channel blue, right red; linear frequency scale).
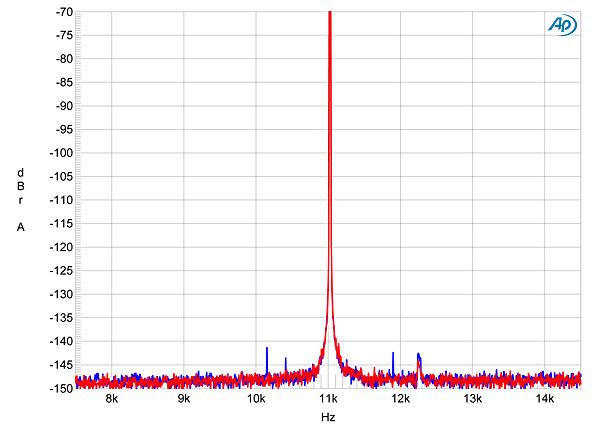
Tested for its rejection of word-clock jitterS/PDIF data fed via 15' of generic TosLink cablethe Hugo TT performed superbly well with 16-bit J-Test data (fig.8), with no sidebands visible, and with the odd-order harmonics of the low-frequency, LSB-level squarewave extremely close to the correct levels (green line). With 24-bit J-Test data, whether via TosLink or USB (fig.9), though there is some slight spectral spreading at the base of the spike that represents the 11.025kHz tone, the noise floor is very clean, despite some very low-level spuriae visible in the left channel (blue trace).
Fig.8 Chord Hugo TT, HF intermodulation spectrum, DC30kHz, 19+20kHz at 0dBFS into 600 ohms, 44.1kHz data (left channel blue, right red; linear frequency scale).
Fig.9 Chord Hugo TT, high-resolution jitter spectrum of analog output signal, 11.025kHz at 6dBFS, sampled at 44.1kHz with LSB toggled at 229Hz: 16-bit data via S/PDIF (left channel blue, right red). Center frequency of trace, 11.025kHz; frequency range, ±3.5kHz.
Fig.10 Chord Hugo TT, high-resolution jitter spectrum of analog output signal, 11.025kHz at 6dBFS, sampled at 44.1kHz with LSB toggled at 229Hz: 24-bit data via USB (left channel blue, right red). Center frequency of trace, 11.025kHz; frequency range, ±3.5kHz.
With a product that offers, shall I say, idiosyncratic measured behavior, I have to spend a lot of time determining whether I have correctly characterized its performance or if there has been some peculiar interaction between the measuring system and the device under test. With Chord's Hugo TT D/A headphone amplifier, I had no such problemsthis is an extraordinarily well-engineered component. I just wish I had had time to listen to it before shipping it back to Jon Iverson. (I took the hint.)John Atkinson
Footnote 1: This test was suggested to me by Jürgen Reis, chief engineer of MBL.