| Columns Retired Columns & Blogs |
Celestion 3000 loudspeaker Measurements
Sidebar 3: Measurements
Footnote 1: Nearly all the measurements were performed on the first pair of loudspeakers, the replacements only arriving in time for a very limited set of measurements to be carried out before the review had to be wrapped up. As the speakers only differed significantly in their distortion performance and mid-to-high treble balance, however, I feel that the basic measurements are valid.—John Atkinson
I use a mixture of nearfield, in-room, and quasi-anechoic FFT techniques (using the DRA Labs MLSSA—pronounced "Melissa"—system from DRA Labs) to investigate objective factors that might explain the sound heard. (Stereophile's measuring microphone is a calibrated DPA 4006.) The 3000's impedance phase and amplitude were measured using Stereophile's Audio Precision System One. Looking at fig.1, it can be seen that the speaker is definitely best rated as a 4 ohm load, the value dropping below 6 ohms above 1kHz and reaching a minimum of 3.25 ohms just below 5kHz. The single peak in the bass reveals the sealed-box woofer tuning at 51Hz. The slight dimple at 500Hz puzzled me; looking at just the woofer impedance revealed it to have something to do with the woofer's low-pass feed, though there doesn't appear to be anything in the four-element low-pass filter to account for this. (Shoving my ear up against the cabinet sidewalls while the speaker was playing pink noise did reveal a faint hoot centered on 500Hz, however.)
The dotted line in fig.1 shows the speaker's electrical phase, which is basically benign. Despite the 3000's lowish overall impedance, it should therefore not present the driving amplifier with any real problems, allowing it to be used with low-powered, sweet-balanced tube amplifiers.
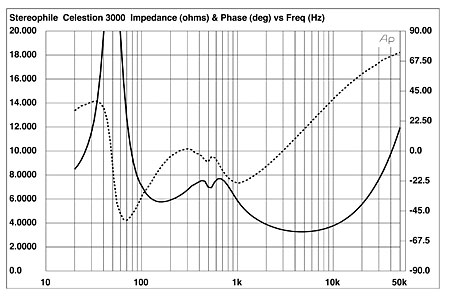
Fig.1 Celestion 3000, electrical impedance (solid) and phase (dashed). (2 ohms/vertical div.)
Fig.2 reveals the anechoic part of the 3000's impulse response, as calculated by the MLSSA system, on the ribbon axis (footnote 1), with fig.3 showing the step response. (The speaker was placed 48" off the floor for this measurement to push the early reflections of the sound as far back in time as possible.) Both the drive-units appear to be connected with the same polarity, the slow rise of the woofer being obscured by the much faster up/down pulse from the ribbon. Note, however, that despite its use of a single drive-unit above 900Hz, the speaker is not particularly time-coherent, presumably due to the highish-order crossover filters used.
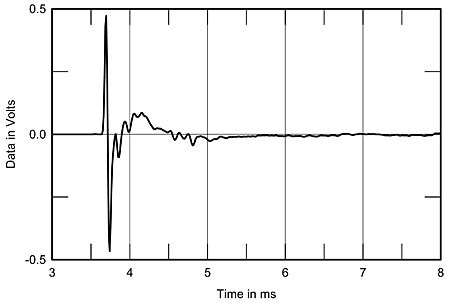
Fig.2 Celestion 3000, impulse response on ribbon axis at 45" (5ms time window, 30kHz bandwidth).
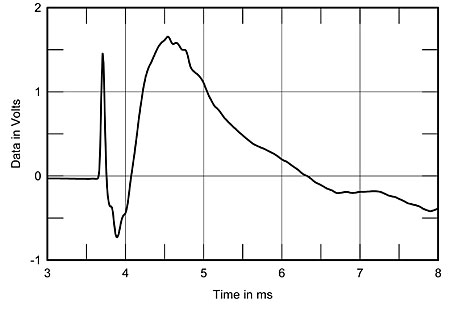
Fig.3 Celestion 3000, step response on ribbon axis at 45" (5ms time window, 30kHz bandwidth).
Using MLSSA's post-processing to give a "waterfall" plot (fig.4) shows how the speaker's frequency response changes as the exciting impulse decays, revealing the presence of resonances as "ridges" parallel to the time axis. Fig.4 shows that the 3000 is basically quite well-behaved in this respect, though some hashy behavior can be seen both in the mid-treble and in the presence region, where a persistent decay ridge can be seen at 3900Hz. Both might contribute to the feeling of subjective brightness that I felt characterized the first pair of speakers' sound. There is also a hint of some untoward behavior around the crossover frequency, which a look at the behavior of the individual drivers suggests is due to the ribbon.
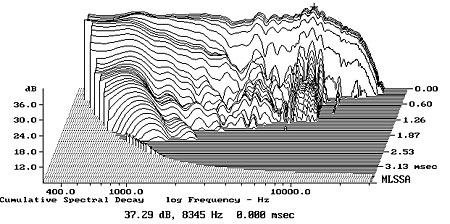
Fig.4 Celestion 3000, cumulative spectral-decay plot at 45" (0.15ms risetime).
The individual anechoic responses of the drive-units of one of the first samples are shown in fig.5. The woofer appears to be quite well-behaved in its passband, though the ribbon's response is spoiled by a rise in the mid-treble, the very region where the residual hashiness could be seen in the waterfall plot. This again suggests that the speaker will be bright in nature, particularly in view of the rolled-off top octave, which will accentuate the subjective effect of the rise in level lower down in frequency. (This rolled-off top octave was also noted by Peter Mitchell in his report last month from the Winter CES—Vol.13 No.4, p.60.)

Fig.5 Celestion 3000, Celestion 3000, acoustic crossover on ribbon axis at 45", corrected for microphone response, with the nearfield responses of the woofer plotted below 350Hz.
To the left of fig.5 is the 3000's bass response, measured in the nearfield; ie, with the microphone almost touching the center of the woofer's dustcap. Gently rolling off below 80Hz, it reaches its –6dB point at 52Hz, fractionally higher than the 49Hz specified.
However, in my experience, a closer correlation with what is heard than that implied by the on-axis response is given by the overall response averaged across a 30° lateral window. This averaged anechoic response for the Celestion 3000, extending from the direct ribbon-axis response to that on an axis 15° off the woofer axis (toward the ribbon), is shown in fig.6. The mid-treble rise is ameliorated with this averaging, which reinforces the idea that the 3000 will change the exact nature of its treble balance for small differences in listener position, meaning that finding the speaker and listener positions that give the optimal balance will have to be a matter for experiment.

Fig.6 Celestion 3000, anechoic response on ribbon axis at 50", averaged across 30° horizontal window and corrected for microphone response, with the nearfield response of the woofer plotted below 300Hz.
In-room, with the speakers about 6" away from the rear wall, this translates to the response shown in fig.7. The wall reinforcement means that there is good low-bass output down to around 32Hz, though even with the spatial averaging performed to derive this curve, which normally smooths out low-frequency irregularities, this is broken up by peaks and dips due to the near-wall placement. The rather lumpy, detached bass character of the first samples could be associated with this aspect of its measured performance (but it is then puzzling why the second samples were better in this respect). The midrange also seems slightly emphasized in this measurement, as does the mid-treble. This might be expected to "throw" detail at the listener, which might explain why the 3000 seems so sensitive to changes in cables and amplifiers. Note, however, that with this first pair of 3000s the top audio octave is depressed, correlating with my feeling that the speakers lacked "air" in the treble, simultaneously managing to sound bright and oversweet.

Fig.7 Celestion 3000, spatially averaged, 1/3-octave response in JA's Santa Fe listening room.
I concluded these measurements of the first pair of speakers by trying to find why I had found the sound to harden so significantly as the level increased. My first thought was that perhaps at high levels the ribbon was moving out of the linear part of the magnetic field, with increased distortion being the inevitable result. Accordingly, I drove the speaker with a 1kHz tone—the low frequency is due to my desire to force the ribbon to move as much as possible—and looked at the distortion spectrum at 76dB, 86dB, and 96dB sound-pressure levels, measured at 1m on the ribbon axis. The harmonic distortion remained low, even at the highest level, so I decided to drive the speaker with a 1:1 mixture of two low-treble tones—2kHz and 3.15kHz—taken from two test CDs each played on a different CD player. (I chose these tones because they lie toward the bottom of the ribbon's passband and because their harmonic distortion products will be of different frequency from any intermodulation products. They were recorded with a nominal level of 0dB, so any distortion from the CD players would be below the threshold of the 12-bit MLSSA A/D converter.)
The results for the left speaker, which was rather worse than the right, are shown in fig.8. The top spectrum was taken at 76dB, and it can be seen that, apart from the 2nd harmonic of the 2kHz tone at 4kHz, which is 49dB below the level of the fundamental, and a similarly small amount of the 1150Hz difference tone, all other distortion products are buried in the noise floor 60–70dB down. At this spl, the Celestion 3000 has about the same distortion as a typical tube power amplifier. (The apparently rising noise floor in the bass is partly due to the analysis system's windowing of the time-domain data, but was also due to some ground-loop hum that I couldn't get rid of when the two CD-player outputs were tied together; the plunge in noise above 15kHz is due to the MLSSA's antialiasing filter being set to 15kHz bandwidth.)

Fig.8 Celestion 3000, lefthand sample 1, intermodulation and harmonic distortion spectrum, (equal 2kHz and 3.15kHz) at 76dB at 1m.
Fig.9 shows what happens when the level is increased by 10dB, to 86dB. A number of harmonic and intermodulation products have sprung up from the noise floor, with, interestingly, the second-order, 2f1-f2, 850Hz product rising to –48.1dB with respect to the 2kHz level, higher than the first-order, f2-f1 difference product at 1150Hz. (The 850Hz product arises from intermodulation between the 3150Hz fundamental and the second harmonic of the 2kHz tone at 4kHz.) None of these products rises above –45dB, around 0.6%, so in loudspeaker terms this is still not that bad.
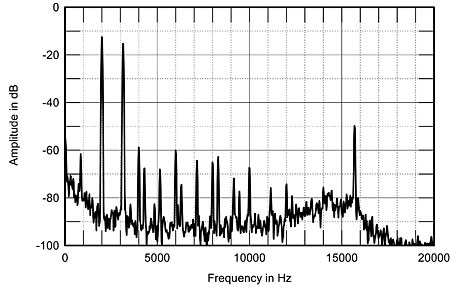
Fig.9 Celestion 3000, lefthand sample 1, intermodulation and harmonic distortion spectrum, (equal 2kHz and 3.15kHz) at 86dB at 1m.
Note, however, what happens when the level is increased by another 10dB, to an admittedly loud 96dB spl (fig.10). A veritable forest of high-frequency harmonic and intermodulation products has sprung up, these ranging between –32dB (just under 3%) and –50dB (0.3%) with respect to the fundamental levels. Note also the low-frequency products: the 850Hz product, indicated by the cursor position, is just 36dB down and 1150Hz 51dB down. Though in percentage terms these might still be thought small, at 1.5% and 0.3% respectively they were actually extremely audible as an added "hum" to the sound of the fundamental tones. No wonder I felt the first pair of Celestions to sound hard at anything other than moderate levels.
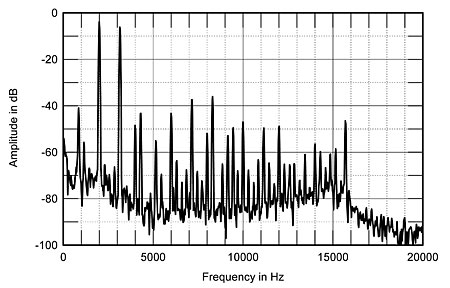
Fig.10 Celestion 3000, lefthand sample 1, intermodulation and harmonic distortion spectrum, (equal 2kHz and 3.15kHz) at 96dB at 1m.
I wondered if this rapid increase in intermodulation distortion was due to the ribbon rubbing on the magnets. The righthand speaker did appear to have very little clearance, but in actual fact, it measured significantly better at this spl than the lefthand speaker, which appeared to have plenty of space between its ribbon and magnets. This therefore can be ruled out as a possible reason for the increase in distortion with spl. I can only conjecture that the step-down transformers for the ribbons in this pair of speakers were saturating at a relatively low level. (The reduced air density at Santa Fe's 2150m altitude reduces a loudspeaker's sensitivity, thus it has to be driven harder than at sea level to reach the same measured spl.) Accordingly, as mentioned in the "Listening" part of this review, I requested a second pair of speakers from Celestion in order to examine whether I was experiencing a sample defect or behavior typical of the speaker.
The second samples arrived at the end of March, about a week before this review was due to be set in type. I immediately set to measuring the distortion spectra under exactly the same conditions as before, the results at 76dB, 86dB, and 96dB spls being shown in fig.11. (The mix of 2kHz and 3.15kHz was again 1:1.) The top spectrum shows the result with the lefthand speaker (the right was effectively identical) at 76dB at 1m. Though overall comparable with the top curve in Fig.8, the distortion is reduced, the 4kHz second-harmonic component being almost 10dB lower in level at –58.8dB (shown by the cursor). As with the original sample at 76dB, however, all other distortion products are at least 60dB down (less than 0.1%), other than the 1150Hz second-order product, which is still 54.3dB down; ie, at an spl of less than 22dB—quite quiet!

Fig.11 Celestion 3000, lefthand sample 2, intermodulation and harmonic distortion spectrum, (equal 2kHz and 3.15kHz) at 76dB at 1m.
Fig.12 shows the distortion components with the level raised to 86dB. Though more harmonic products are visible, these are significantly lower in level than those produced by the original lefthand speaker at the same spl. The cursor shows the level of the 850Hz intermod component at –52.1dB, a little lower than the level of 850Hz at 86dB shown in fig.9 (–48.1dB). At the 96dB level (fig.13), there are still many harmonic and intermodulation products visible, though with the exception of the 850Hz and 1150Hz difference products, their levels are on average 10dB lower than the levels of the same components when produced by the original lefthand speaker, nearly all remaining 50dB down or lower; ie, none higher than 0.3% of the fundamental level. This does correlate with the fact that the second samples of the 3000 sounded considerably easier on the ear at high levels than the first.
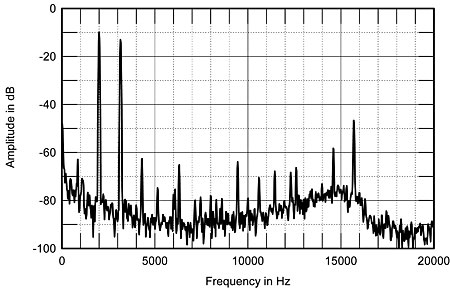
Fig.12 Celestion 3000, lefthand sample 2, intermodulation and harmonic distortion spectrum, (equal 2kHz and 3.15kHz) at 86dB at 1m.

Fig.13 Celestion 3000, lefthand sample 2, intermodulation and harmonic distortion spectrum, (equal 2kHz and 3.15kHz) at 96dB at 1m.
The new samples also measured rather differently in their top-octave balance. Fig.14 shows the anechoic responses on the ribbon axis of the two lefthand speakers. The red curve is that of the first sample; the blue one is the second sample, which can be seen to have more HF energy within a very similar response trend.
Finally, Celestion claims good lateral dispersion for the 3000. I therefore took a number of response measurements of the second sample, starting on the ribbon axis and ending perpendicular to the woofer baffle with the mike pointing at the ribbon slot; ie, 45° off the ribbon axis. The ribbon-axis response is the central curve in fig.15, and is the same as in fig.14; in front of that is the curve 15° off-axis, which shows the same shape but with slightly less top-octave energy; in front of that is the response 30° off-axis, the axis on which I ended up listening to the speakers. Note that as found during the auditioning, the mid-treble has flattened out here at the expense of more top-octave roll-off, while the fourth curve is the response on the woofer axis—place these speakers too close together and you'll get a sound that is both bright and rather defocused. Overall, however, these four curves confirm that the 3000's ribbon does have excellent lateral dispersion up to 10kHz or so.

Fig.14 Celestion 3000, comparison of ribbon-axis response of original sample (red) and second sample (blue).
With a typical listening-axis response like the third curve in fig.15, why should the Celestion 3000 tend to sound bright? I think the answer is threefold. First is that the residue of resonant problems in the mid-treble revealed by the waterfall plot will add a degree of emphasis in this region even when the response is nominally flat. Second, the wide horizontal dispersion in the treble typical of the ribbon will endow the room sound with a degree of mid-treble emphasis, particularly if the room is not that well damped in the highs. Third—and this applies more to the first samples than to the second, as well as to the samples demonstrated by Celestion at the WCES, to judge by Peter Mitchell's measurements in the April issue and Dick Olsher's comments in the March issue, p.93—if the top audio octave is deficient in energy, it will throw into sharp relief any problems in the two octaves below, accentuating any tendency to brightness.

Fig.15 Celestion 3000, lateral response family at 45", normalized to response on midrange axis, from back to front: differences in response 90–5° off axis, reference response, differences in response 5–90° off axis.
Finally, as noted from the auditioning, as is to be expected with such a long diaphragm, the treble response falls off rapidly for a listener not listening directly to the ribbon. Fig.16 shows the response taken on the ribbon axis with the mike 15° above the cabinet top, typical of a standing listener about 9' away. Stand in front of a pair of Celestion 3000s and you will get an untypically dull balance.—John Atkinson

Fig.16 Celestion 3000, response on ribbon axis above cabinet top, corrected for microphone response.
Footnote 1: Nearly all the measurements were performed on the first pair of loudspeakers, the replacements only arriving in time for a very limited set of measurements to be carried out before the review had to be wrapped up. As the speakers only differed significantly in their distortion performance and mid-to-high treble balance, however, I feel that the basic measurements are valid.—John Atkinson
- Log in or register to post comments
