| Columns Retired Columns & Blogs |
Cary Audio Design SLP 05 preamplifier Measurements
Sidebar 3: Measurements
The SLP 05 offered slightly different maximum gains from the figures specified on Cary's website. However, the specified gain is different on the Specifications page—10dB single-ended, 8dB, balanced—from what it is on the Literature page—12dB. In a telephone conversation AD had with Cary's Dennis Had, Dennis said that the 10dB/8dB numbers were a misprint, the real numbers were 16dB unbalanced and 12dB balanced. With both input-level controls and the volume control at their maximum settings, I measured 15.3dB for unbalanced input to unbalanced output and 13.8dB for balanced input/output. The difference, perhaps, is due to inconsistencies in the tube gains. Usually, such differences would have been minimized by negative feedback, but the SLP 05 apparently doesn't use any negative feedback. The Cary preamp preserved absolute polarity from both sets of outputs— ie, was noninverting—and the input impedance was close to specification for the single-ended RCA jacks, at 46k ohms across the audioband. The balanced XLRs, however, had an input impedance of 200k ohms rather than the specified 100k, unless the latter refers to each phase of the balanced connection. The difference is moot, however, given the high value in either case.
The SLP 05's output impedance is specified as a usefully low 400 ohms. However, I got significantly higher values for the unbalanced output of 1500–1600 ohms in the midrange and treble, rising to 3400 ohms at 20Hz, with similar if slightly lower figures for the balanced output. The Cary preamp needs to be used with power amplifiers having input impedances of 10k ohms or greater if the bass is not to sound a little lean.
The effect of the highish output impedance can be seen in fig.1, which shows the unbalanced frequency response into a variety of loads, ranging from 600 ohms (bottom curve below 200Hz) to 100k ohms (top curve below 200Hz). Unusually, the effect of increasing load impedance at the other end of the spectrum is to increase the preamp's bandwidth. While the SLP 05's output is down 3dB at 80kHz into 100k ohms, this decreases to –2.5dB into 10k ohms and just –0.75dB into 1k ohm.

Fig.1 Cary SLP 05, unbalanced frequency response, volume control at max, at 1V into (from top to bottom at 100kHz, bottom to top at 20Hz): 600, 1k, 10k, 100k ohms (1dB/vertical div.).
The opposite effect was evident from the balanced outputs (fig.2), where the bandwidth decreased with the load impedance at both ends of the spectrum. Note the channel imbalance in this graph: the right channel offers about 1.2dB more gain than the left. This graph was taken with the volume control at its highest setting, and I initially assumed that the imbalance was due to poor tracking at the extremes of the control's travel. However, reducing the control to unity gain (12:00) preserved the channel imbalance. Again, perhaps this is due to differing tube characteristics, but it can be eliminated with the input-level controls, of course.

Fig.2 Cary SLP 05, balanced frequency response, volume control at max, at 1V into (from top to bottom at 100kHz and 20Hz): 100k, 600 ohms (1dB/vertical div., right channel dashed).
Channel separation was disappointing if satisfactory at >70dB below 2kHz, due to what appears to be capacitive coupling (fig.3). The unbalanced signal/noise ratio, taken with the input shorted but with the level and volume controls set to their maximums, was a good 82dB (unweighted, wideband figure ref. 1V output), this improving to 90dB when A-weighted. The balanced figures were all around 15dB worse.

Fig.3 Cary SLP 05, unbalanced channel separation with volume control at unity gain (10dB/vertical div.).
The SLP 05 could swing high voltages before clipping. Almost 11V is available at 1% THD into 100k ohms, as can be seen in fig.4, which plots the percentage of distortion and noise in the unbalanced output against voltage. This is well above the level required to drive any power amplifier to its maximum output. Unusually, the Cary was more linear into 10k ohms (bottom trace) than it was into the theoretically less demanding 100k ohm load (middle trace). The distortion components start to rise out of the noise into this load at around 1V output, where the THD+N is commendably low at <0.02%. The top trace in this graph, however, taken into 1k ohm indicates that the SLP 05 is uncomfortable driving impedances this low. The balanced jacks clipped at much the same output voltages (not shown).

Fig.4 Cary SLP 05, unbalanced distortion (%)vs 1kHz output voltage into (from bottom to top at 1V): 100k, 10k, 1k ohms.
Following the indication given in fig.4—that the amplifier's THD+N figure was dominated by noise much below 1V output—I plotted the THD+N percentage against frequency at 1V (fig.5). Again, this graph shows that the SLP 05 offers the least distortion into 10k ohms, the midband figure reaching 0.018%, which is very low considering the SLP 05's zero-feedback design. However, it does rise at the frequency extremes and into loads much below 10k ohms. This graph also reveals that, into 100k ohms, the balanced output offers more than twice the distortion of the unbalanced.

Fig.5 Cary SLP 05, THD+N (%)vs frequency at 1V into (from bottom to top at 1kHz): 10k ohms unbalanced, 100k unbalanced, 100k balanced, 3k unbalanced, 1k unbalanced (right channel dashed, balanced only).
What matters more than the absolute level of distortion is its spectral makeup, and in this regard the Cary preamp gets home safe. Fig.6 shows the spectrum of the SLP 05's unbalanced output driving a 1kHz tone at 1V into 8k ohms. The THD measured 0.023% (true sum of the harmonics), with the subjectively benign second and third harmonics present at –74dB (0.02%) and –82dB (0.007%). (The fourth harmonic lies at –112dB in this graph, which is close to the signal generator's residual.) As the output level increases and/or the load decreases, the second and third harmonics increase, but no higher-order harmonics make an appearance. The balanced output behaves similarly, but with a higher level of second harmonic present, perhaps due to a mismatch between the two halves of the active balanced circuit. The SLP 05 produced commendably low levels of intermodulation distortion, particularly from its unbalanced jacks (fig.7).

Fig.6 Cary SLP 05, unbalanced spectrum of 1kHz sinewave, DC–1kHz, at 1V into 8k ohms (linear frequency scale).
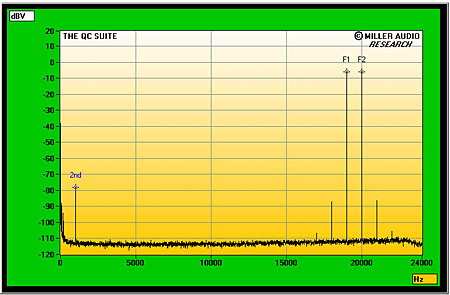
Fig.7 Cary SLP 05, unbalanced HF intermodulation spectrum, DC–24kHz, 19+20kHz at 1V peak into 8k ohms (linear frequency scale).
Though it has some anomalies, such as being happier with 10k ohm loads than with 100k ohms, the Cary SLP 05 offers respectable measured performance from its unbalanced jacks. I was a little disappointed with its behavior in balanced mode, however.—John Atkinson
|
|
| ||||||||||
- Log in or register to post comments


| Loudspeakers Amplification Digital Sources | Analog Sources Accessories Featured | Music Columns Retired Columns | Show Reports | Features Latest News Community | Resources Subscriptions |
 © 2024 Stereophile
AVTech Media Americas Inc., USA
All rights reserved

