| Columns Retired Columns & Blogs |
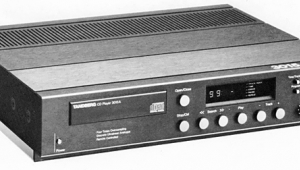
California Audio Labs Icon Mk.II Power Boss CD player Measurements
Sidebar 3: Measurements
The Icon Mk.II HDCD's maximum output level was a moderately high 2.7V. The Icon II's measured output impedance was a very low 34 ohms. For comparison, the CAL Sigma D/A processor's output impedance was between 1.5k ohms and 2k ohms depending on frequency. The output stage became current-limited when driving less than 13.8k ohm input impedance. CAL's original Tempest CD player had a source impedance of a whopping 5600 ohms. The change in engineering philosophy that resulted in such a low source impedance, 34 ohms, in the new Icon II is a move in the right direction. It wouldn't surprise me if the Icon Mk.II had tighter and deeper-sounding bass than the CAL products with high output impedances.
DC levels were a low 1.6mV (left channel) and 0.4mV (right channel), and the Icon Mk.II doesn't invert absolute polarity. The Icon II performed moderately well on the Pierre Verany tracking test, reaching track 34 before the player started skipping.
Frequency response was ruler-flat, as was the de-emphasis response (fig.1). The Icon's channel separation was good, measuring better than 100dB at 1kHz (fig.2). The left channel (solid trace) exhibited a rise at low frequencies, which may be the result of noise in the left channel rather than a true reduction in channel separation.
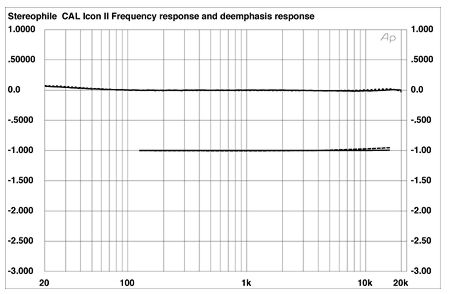
Fig.1 CAL Icon Mk.II HDCD, frequency response (top) and de-emphasis error (bottom) (right channel dashed, 0.5dB/vertical div.).

Fig.2 CAL Icon Mk.II HDCD, crosstalk (R–L channel dashed, 10dB/vertical div.).
This was indeed the case, as revealed by the very high noise levels in the 1/3-octave spectral analysis of the Icon Mk.II's output when decoding a 1kHz –90dB dithered sinewave (fig.3). The left channel (solid trace) had high levels of power-supply noise (at 60Hz and its harmonics) intruding on the audio signal. The wideband spectral analysis (fig.4) confirms the high noise level, and shows the gentle rolloff above the audioband.
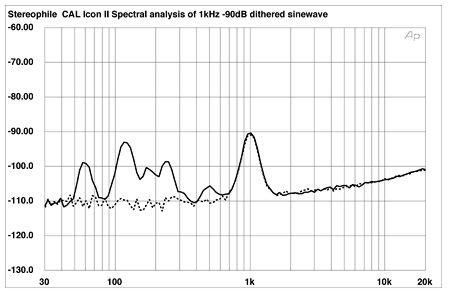
Fig.3 CAL Icon Mk.II HDCD, spectrum of dithered 1kHz tone at –90.31dBFS, with noise and spuriae (16-bit data, 1/3-octave analysis, right channel dashed).
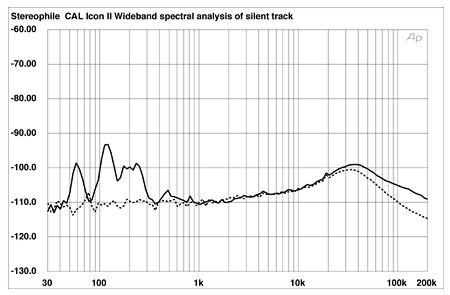
Fig.4 CAL Icon Mk.II HDCD, spectrum of digital silence (16-bit data, 1/3-octave analysis, right channel dashed).
The Icon's low-level linearity (fig.5) was excellent, measuring better than other CD players based on 1-bit DACs we have reviewed (the CAL player uses a pair of Burr-Brown PCM1702 20-bit ladder DACs). The apparent positive "linearity error" below –100dB is because of noise intruding on the signal.

Fig.5 CAL Icon Mk.II HDCD, left channel, departure from linearity (2dB/vertical div.).
Fig.6 is the Icon II's reproduction of a 1kHz –90.31dBFS undithered sinewave. The waveshape is not as good as that of other PCM1702-based converters I've measured, and the trace is shifted downward by some negative DC offset and modulated by the power-supply noise.

Fig.6 CAL Icon Mk.II HDCD, waveform of undithered 1kHz sinewave at –90.31dBFS (16-bit data).
The Icon II's intermodulation spectrum (fig.7) shows that the IMD products are few in number, but that the 1kHz difference product (20kHz minus 19kHz) almost reaches –80dBFS (0.01%).

Fig.7 CAL Icon Mk.II HDCD, HF intermodulation spectrum, DC–24kHz, 19+20kHz at 0dBFS (linear frequency scale, 20dB/vertical div.).
I measured the Icon Mk.II's jitter performance at the 8x word-clock pin on the PCM1702 DAC with the Meitner LIM Detector. Fig.8 is the clock-jitter spectrum when the Icon was playing a 1kHz full-scale sinewave. The trace is fairly clean, with only a few periodic jitter components seen as the spikes in the trace. The RMS jitter level was 100ps. With an input signal of all zeros, the jitter spectrum (fig.9) was cleaner and the RMS jitter level dropped slightly to 90ps. Playing a 1kHz –90dB sinewave produced the classic periodic jitter components at the test signal frequency (fig.10), and bumped the RMS jitter level back to 100ps. This jitter performance is better than that of many separate digital processor/transport combinations, whose jitter performance is degraded by the S/PDIF interface between them. Most processors show stronger periodic jitter components when using low-level test signals. These jitter measurements highlight that it's easier to get good jitter performance from a CD player than it is from separate transports and digital processors.

Fig.8 CAL Icon Mk.II HDCD, word-clock jitter spectrum, DC–20kHz, when processing 1kHz sinewave at 0dBFS; (linear frequency scale, 10dB/vertical div., 0dB=1ns).
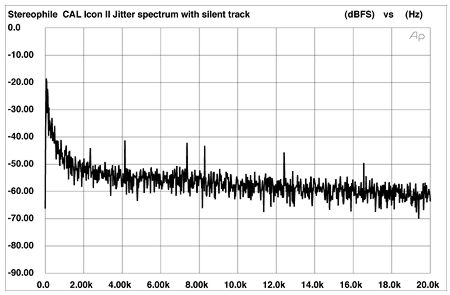
Fig.9 CAL Icon Mk.II HDCD, word-clock jitter spectrum, DC–20kHz, when processing digital silence; (linear frequency scale, 10dB/vertical div., 0dB=1ns).

Fig.10 CAL Icon Mk.II HDCD, word-clock jitter spectrum, DC–20kHz, when processing 1kHz sinewave at –90dBFS; (linear frequency scale, 10dB/vertical div., 0dB=1ns).
Although the Icon II appears to be well designed, with attention to sound quality, I was disturbed by the high noise level, particularly the power-supply noise in the left channel.—Robert Harley
|
|
| ||||||||||
- Log in or register to post comments


| Loudspeakers Amplification Digital Sources | Analog Sources Accessories Featured | Music Columns Retired Columns | Show Reports | Features Latest News Community | Resources Subscriptions |
 © 2024 Stereophile
AVTech Media Americas Inc., USA
All rights reserved

