| Columns Retired Columns & Blogs |
B&W 705 loudspeaker Measurements
Sidebar 3: Measurements
The 705's sensitivity was to specification, at an estimated 89.2dB(B)/2.83V/m, which is a little above average. Its impedance (fig.1) remained above 5 ohms throughout the audioband, dropping to 4.2 ohms only above 15kHz and staying above 6 ohms for almost the entire midrange and treble. The small blip at 31kHz implies that the tweeter's fundamental dome resonance lies much higher than usual. The saddle at 40Hz in the magnitude trace indicates the tuning frequency of the big-mouthed port. Blocking this with the supplied foam plug produced a classic sealed-box impedance curve (fig.2), with a single bass peak at 73Hz indicating the woofer tuning.
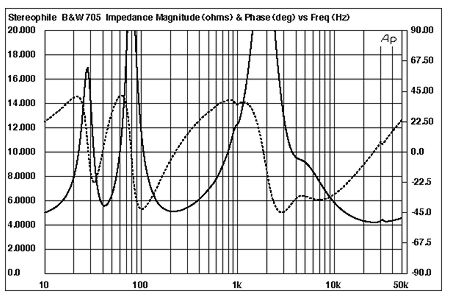
Fig.1 B&W 705, electrical impedance (solid) and phase (dashed) with reflex port open. (2 ohms/vertical div.)
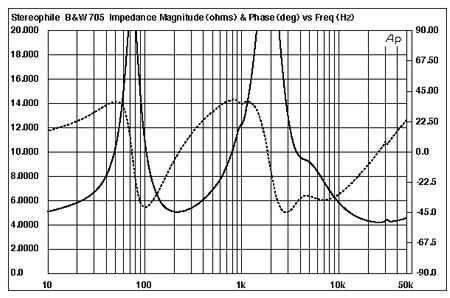
Fig.2 B&W 705, electrical impedance (solid) and phase (dashed) with reflex port sealed. (2 ohms/vertical div.)
The impedance traces are generally free from the glitches that would indicate the presence of cabinet resonances. However, while there is a suspicious-looking discontinuity in fig.1 at 900Hz, investigating the vibrational behavior of the 705's cabinet panels revealed nothing untoward at that frequency. I did find a number of moderate panel resonances, at 285Hz, 490Hz, and 600Hz (fig.3); these might be low enough in level and high enough in frequency not to have an effect on the speaker's sound quality.
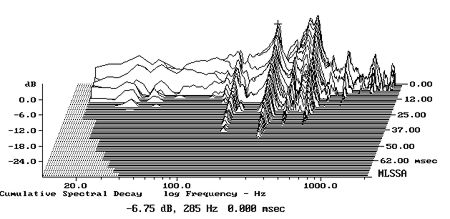
Fig.3 B&W 705, cumulative spectral-decay plot calculated from the output of an accelerometer fastened to the cabinet's side panel. (MLS driving voltage to speaker, 7.55V; measurement bandwidth, 2kHz.)
Fig.4 shows the individual outputs of, from left to right, the port, woofer, and tweeter. The port's response peaks just above the woofer's minimum-motion point at 38Hz, with a gentle rollout above that frequency. Although there is a peak in the port's output at 900Hz, the frequency of the glitch in the impedance traces, it is well down in level. However, it does coincide with a slight suckout in the woofer's output—something is going on inside the speaker in this region. The woofer starts to roll off a little earlier than the specified 3.7Hz, with a relatively gentle acoustic slope. A small spike at 12.5Hz in its response is probably due to a residual cone breakup mode. The tweeter comes in with a steep 24dB/octave acoustic slope and is flat on-axis up to 20kHz, the usual pre-resonance notch being pushed up to the 25kHz region before the inevitable rise at the tweeter dome's resonant frequency just above 30kHz.
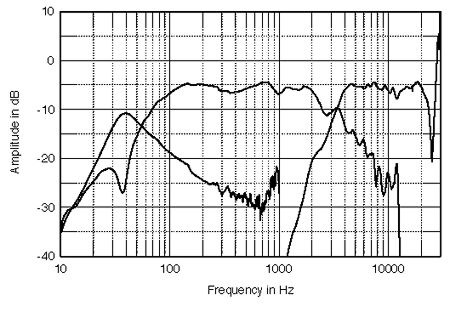
Fig.4 B&W 705, acoustic crossover on tweeter axis at 50", corrected for microphone response, with nearfield responses of the woofer and port plotted below 350Hz and 1kHz, respectively.
How these individual responses sum in the farfield is shown in fig.5. The 705's balance is very flat, disturbed by a slight lack of energy in the crossover region. Given that the low-frequency behavior was obtained with a nearfield technique, the lack of a slight boost below 300Hz means that the speaker's bass is actually a little overdamped rather than being maximally flat. The red trace in this graph is the woofer's nearfield output with the port plugged. Rolling off below 100Hz, it would give a smooth transfer of power to a subwoofer, if one were used. At the other end of the spectrum, the tweeter's limited dispersion above 10kHz gives a slight shelving-down in this graph, which was obtained by averaging seven responses taken at 5 degrees intervals across a 30 degrees horizontal window centered on the tweeter axis. In addition, this graph was taken with the tweeter grille in place, which boosts the response slightly below 10kHz, at the expense of the output an octave higher.
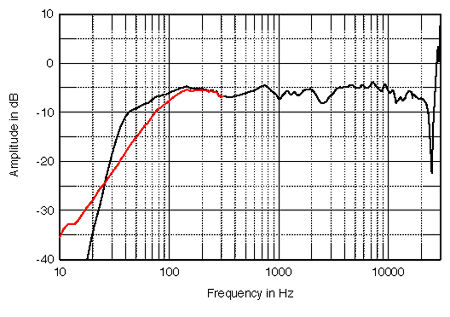
Fig.5 B&W 705, anechoic response on tweeter axis at 50", averaged across 30 degrees horizontal window and corrected for microphone response, with the complex sum of the nearfield woofer and port responses, taking into account acoustic phase and distance from the nominal farfield point, plotted below 300Hz (black). The nearfield response of the woofer with the reflex port blocked is plotted in red.
The 705's lateral dispersion is shown in fig.6. Though the speaker does roll off to the sides of the tweeter axis above 10kHz, this is not by as much as I was expecting. Note how evenly spaced the contour lines are in this graph, which correlates with the stable, well-defined stereo imaging. There is a very slight flare in the off-axis output in the crossover region, which in a typical room will tend to compensate for the on-axis suckout in the same region. Also, as can been from fig.6, the on-axis notch at 25kHz fills in to the sides, meaning that as the traces in this graph are normalized to the on-axis response, this filling appears as peaks. Don't be misled; that they are not peaks is apparent from a graph showing the actual response plots (fig.7).
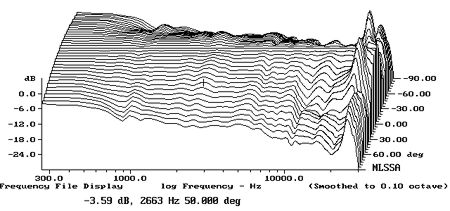
Fig.6 B&W 705, lateral response family at 50", normalized to response on tweeter axis, from back to front: differences in response 90 degrees-5 degrees off axis, reference response, differences in response 5 degrees-90 degrees off axis.
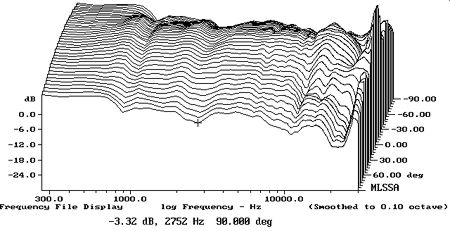
Fig.7 B&W 705, lateral response family at 50", from back to front: responses 90 degrees-5 degrees off axis, on-axis response, responses 5 degrees-90 degrees off axis.
In the vertical plane (fig.8), sitting just above the tweeter results in more presence-region energy, at the expense of the top octave. Sit too low, however, and a large suckout develops in the crossover region. Fig.9 shows the spatially averaged response for the B&W 705, taken in my listening room in a vertical grid centered on my ear position. Other than the prematurely rolled-off midbass—remember that overdamped woofer alignment—this is extraordinarily flat. No wonder I thought the 705 sounded neutral.
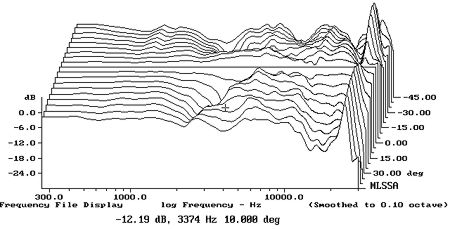
Fig.8 B&W 705, vertical response family at 50", normalized to response on tweeter axis, from back to front: differences in response 45 degrees-5 degrees above axis, reference response, differences in response 5 degrees-45 degrees below axis.

Fig.9 B&W 705, spatially averaged, 1/3-octave response in JA's listening room.
The B&W's step response (fig.10) shows the tweeter output slightly preceding but smoothly integrating with that of the woofer. The farfield cumulative spectral-decay plot (fig.11) is extremely clean, broken only by the tweeter's ultrasonic resonance and the low-level woofer-cone breakup mode noted earlier.

Fig.10 B&W 705, step response on tweeter axis at 50" (5ms time window, 30kHz bandwidth).

Fig.11 B&W 705, cumulative spectral-decay plot at 50" (0.15ms risetime).
Overall, the 705's measured performance reveals superb speaker engineering on the part of B&W.—John Atkinson
|
| ||||||||||
- Log in or register to post comments


| Loudspeakers Amplification Digital Sources | Analog Sources Accessories Featured | Music Columns Retired Columns | Show Reports | Features Latest News Community | Resources Subscriptions |
 © 2024 Stereophile
AVTech Media Americas Inc., USA
All rights reserved

