| Columns Retired Columns & Blogs |
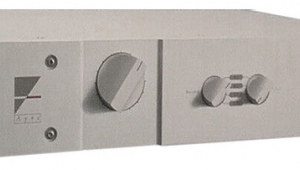
Bryston BP25-MC preamplifier Measurements
Sidebar 3: Measurements
Unless otherwise noted, the measurements presented are for unbalanced operation. The output impedance of the BP-25 at its line output measured 50 ohms (99 ohms, balanced), with insignificant variations with changes in the level control. The line-level input impedance measured 48k ohms (16.6k ohms, balanced), left, and 49.5k ohms, right, again virtually independent of the level control. Phono input impedance measured 50k ohms (MM) and 220 ohms (MC). The output impedance at the tape output was just 99 ohms regardless of source impedance, indicating full buffering of the tape outputs.
DC offset at the BP-25's outputs was unmeasurable. The preamp is non-inverting from its line inputs to its main outputs or its phono inputs to its tape outputs (we take all phono measurements at the tape outputs) in the unbalanced mode; in the balanced mode pin 2 is positive. Line-stage voltage gain (CD input to line output) measured 10.6dB, unbalanced and 16.5dB, balanced. Phono gain measured 35.4dB (MM) and 57.1dB (MC). S/N measured 99dB (unweighted) over a bandwidth of 22Hz-22kHz, 82dB (unweighted, 10Hz-500kHz) and 102dB, A-weighted (all ref. 1V) for the line stage. The same readings for the phono stages were, respectively, 76dB, 71dB, and 82dB (MM) and 69dB, 66dB, and 78dB (MC). The balanced line readings were 95dB, 81dB, and 97dB—slightly less than the unbalanced readings.
The frequency responses of the BP-25 are shown in fig.1. Though not readily apparent from this graph, I found the level control tracking to be good; no more than 0.3dB variation from a 9:00 setting to maximum. The only item worthy of note in fig.1 is the high-frequency rolloff in the moving-coil response, just over –3dB at 20kHz—we don't think it is a measurement artefact; perhaps it is some sort of compensation for the often-rising high-end response of moving-coil cartridge (a useful idea, but it should be defeatable, in my judgement).
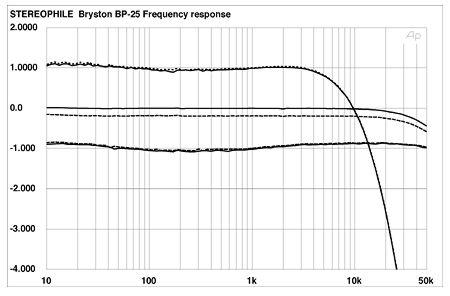
Fig.1 Bryston BP25-MC, frequency response at 1V output into 100k ohms for (from top to bottom at 1kHz): MC phono, line, MM phono line (right channel dashed, 0.5dB/vertical div.).
The crosstalk of the BP-25 is shown in fig.2. All increase with frequency in the expected manner, due to capacitive coupling. While there are significant differences between the channels, particularly in the phono stages, the absolute separation is so great in the worst case that I consider this to be of academic interest only. The input voltages used here, were quite high—the only way to keep the low noise level of the BP-25 from swamping its even lower crosstalk. The line input voltage used was 2.4V, the MM input 152mV, and the MC input 16.8mV—all far higher than you would ever see in practice.

Fig.2 Bryston BP25-MC, crosstalk (from bottom to top at 1kHz): L-R, R-L, line; L-R, MC; L-R, MM; R-L, MC; R-L, MM (10dB/vertical div.).
Using the same high input levels, the THD+noise vs frequency for the BP-25 is shown in fig.3 (the balanced result is also shown here, using a 1.2V input, which results in the same output voltage as 2.4V input in the unbalanced mode). Again, the distortion levels are vanishingly small. The rise in the high-frequency distortion in the phono stages is simply due to the high input levels used in the test to minimize the effects of noise, and should have no audible consequences.

Fig.3 Bryston BP25-MC, THD+noise vs frequency at (from top to bottom at 1kHz): MC phono; line, balanced; MM, phono; and line, unbalanced (right channel dashed).
Fig.4 shows the THD+noise percentage plotted against output voltage at 1kHz. The minimum points in the curves, just before the distortion increases rapidly, were the values chosen to run the measurements plotted in figs.2 and 3. The rise in apparent distortion with decreasing output voltage is simply due to the fact that the actual distortion content is below the noise at these levels.

Fig.4 Bryston BP25-MC, distortion (%) vs output voltage into 100k ohms (from bottom to top at 1V): line, MM, MC inputs.
The BP-25's output spectrum reproducing 50Hz at a very high output level of 10V is shown in fig.5. While some artifacts pop out from the background, they are at an extremely low level (close to –100dB or 0.001%).

Fig.5 Bryston BP25-MC, spectrum of 50Hz sinewave, DC-1kHz, at 10V into 100kHz (linear frequency scale). Note that the third harmonic is the highest in level at -97dB (about 0.0015%).
Finally, the phono overload margin of the BP-25 was also very good; for the moving magnet setting, 1% THD+noise was reached at an input of 261mV at 1kHz, 2.26V at 20kHz, and 28mV at 20Hz. The input signal used for the latter measurements was unequalized and the variation with overload margin with frequency is due to the characteristics of the RIAA curve.
There is little to comment on in the test bench performance of the BP-25. Apart from the HF response of the moving coil input—which may have been deliberate and therefore defensible—the results are superior right down the line.—Thomas J. Norton
|
|
| ||||||||||
- Log in or register to post comments


| Loudspeakers Amplification Digital Sources | Analog Sources Accessories Featured | Music Columns Retired Columns | Show Reports | Features Latest News Community | Resources Subscriptions |
 © 2024 Stereophile
AVTech Media Americas Inc., USA
All rights reserved

