| Columns Retired Columns & Blogs |
Bryston 14B-SST power amplifier Measurements
Sidebar 4: Measurements
After checking for continuity and the optimal grounding between the device under test and the Audio Precision System One test gear, my usual routine for an amplifier review is to run the amp for 60 minutes at 1/3 power into 8 ohms. This preconditioning both thermally stresses the amplifier and makes sure its operating conditions have stabilized.
With the Bryston 14B-SST, however, not only was its chassis too hot to touch after just 20 minutes of driving 200Wpc into 8 ohms, it turned itself off after 25 minutes. While this IHF-recommended test is very much the worst case for a design with a class-B output stage and it is unlikely the 14B-SST will get this hot under normal use with music, it does suggest that the amplifier's heatsinking is underspecified for continuous use at high levels. (Unlike the Chord integrated amplifier that I measured in our July 2001 issue, the Bryston's THD didn't increase in level as the amplifier heated up.)
Once the amplifier had cooled down and turned itself back on, I went on with my testing. The input impedance at 1kHz was to spec at 14.8k ohms balanced and 46.4k ohms unbalanced, and the amplifier didn't invert polarity from either input. (The XLR/TRS jacks are wired with pin 2 hot.) The voltage gain into 8 ohms was 28.9dB unbalanced and balanced, this dropping by 6dB with the balanced attenuator engaged. The output impedance measured 0.12 ohm across most of the band (this figure includes the series resistance of 6' of speaker cable), rising slightly to 0.21 ohm at 20kHz.
As a result of this low source impedance, there was very little interaction between it and the speaker impedance: just +0.2dB, -0.1dB, according to fig.1. This graph also reveals that the 14B-SST's ultrasonic bandwidth decreases with decreasing load impedance. The response is 3dB down at 148kHz into 8 ohms, at 100kHz into 4 ohms, and at 55kHz into 2 ohms. The response is down 1.4dB at 20kHz in the latter case, which might be just audible. These curves were taken using the unbalanced input; via the balanced input, the ultrasonic output was slightly more curtailed, at -3dB at 105kHz into 8 ohms, though this will not be subjectively significant. As a result of the high -3dB frequency, the 14B-SST's reproduction of a 10kHz squarewave was essentially perfect (fig.2).
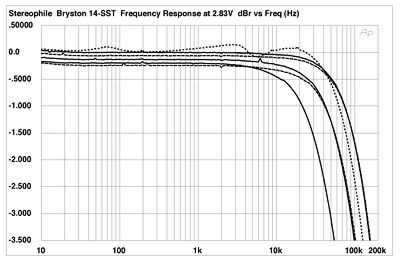
Fig.1 Bryston 14B-SST, unbalanced frequency response at (from top to bottom at 2kHz): 2.83V into dummy loudspeaker load, 1W into 8 ohms, 2W into 4 ohms, 4W into 2 ohms (0.5dB/vertical div., right channel dashed).
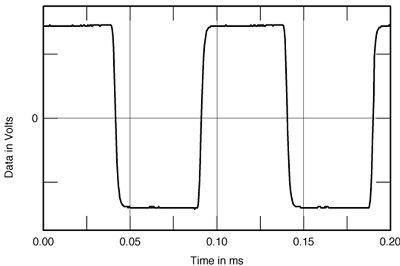
Fig.2 Bryston 14B-SST, small-signal 10kHz squarewave into 8 ohms.
Channel separation was superb, at better than 110dB in both directions below 3kHz, while the Bryston was also very quiet. The A-weighted signal/noise ratio ref. 1W into 8 ohms was 96.5dB. The unweighted audioband ratio was only slightly less good, at 93.5dB, though this did worsen to 78dB with a wide measurement bandwidth. These figures were all for the left channel; the right channel was somewhat worse due to the presence of some 60Hz, 180Hz, and 300Hz hum components. Nevertheless, these were still well low enough in level to be inaudible.
This increased noise level in the right channel can be seen in fig.3, which plots the amplifier's small-signal distortion and noise against frequency. Other than at high frequencies, where there is a very slight increase in THD into the lower impedances, in this graph you're really looking only at noise. (The rise in the right-channel percentage in the mid-treble is with the 14B-SST driving our simulated speaker load.)
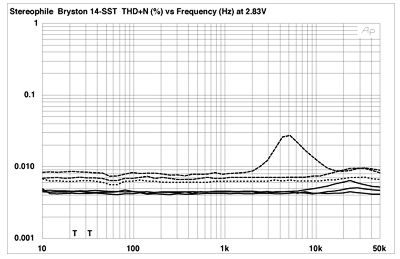
Fig.3 Bryston 14B-SST, THD+N (%) vs frequency at 2.83V into (from bottom to top at 4kHz): 8 ohms, 4 ohms, 2 ohms, simulated loudspeaker load (right channel dashed).
Increasing the power level and averaging 32 separate measurements to reduce the effect of noise reveals that what distortion is present—just 0.0038%—is almost pure third harmonic (fig.4). There did appear to be some high harmonics (fig.5) at high power and low frequencies, but these are at vanishingly low levels. The level of intermodulation products present with the demanding mixture of 19kHz and 20kHz tones was also very low (fig.6), despite the very high power at which this spectrum was taken: 331W into 4 ohms, which was close to visible clipping on the oscilloscope screen.
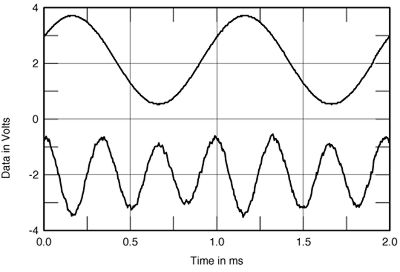
Fig.4 Bryston 14B-SST, 1kHz waveform at 17W into 4 ohms (top); distortion and noise waveform with fundamental notched out (bottom, not to scale).
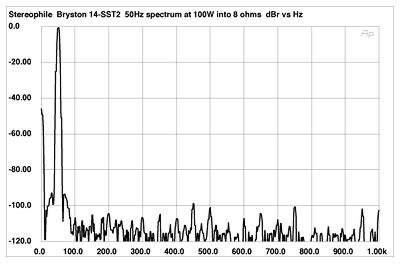
Fig.5 Bryston 14B-SST, spectrum of 50Hz sinewave, DC-1kHz, at 100W into 8 ohms (linear frequency scale).
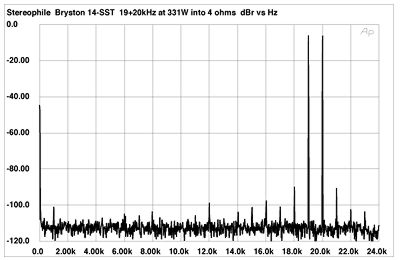
Fig.6 Bryston 14B-SST, HF intermodulation spectrum, DC-24kHz, 19+20kHz at 331W into 4 ohms (linear frequency scale).
Finally, fig.7 plots the percentage of THD+N against continuous output power with both channels driven into 8 and 4 ohms and one channel driven into 2 ohms. Despite its 600W, 27.8dBW specification, the 14B-SST delivered no less than 690W into 8 ohms (28.4dBW) at the 1% THD point we define as clipping. The clip point into 4 ohms was just over a kilowatt (27dBW), but the amplifier was running out of grunt into 2 ohms, with 720W available at clipping (22.6dBW).—John Atkinson
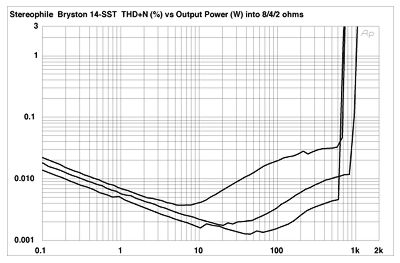
Fig.7 Bryston 14B-SST, distortion (%) vs continuous output power into (from bottom to top at 1W): 8 ohms, 4 ohms, 2 ohms.
|
|
| ||||||||||
- Log in or register to post comments


| Loudspeakers Amplification Digital Sources | Analog Sources Accessories Featured | Music Columns Retired Columns | Show Reports | Features Latest News Community | Resources Subscriptions |
 © 2024 Stereophile
AVTech Media Americas Inc., USA
All rights reserved

