| Columns Retired Columns & Blogs |
Boulder 1012 D/A preamplifier Measurements part 3
The distortion through the 1012's analog input was superbly low in level across the band, as shown by fig.11, taken at almost 10V into 100k ohms. Fig.12 shows a spectral analysis of a full-scale 50Hz digital tone—the low-order harmonics are each below -100dB (0.001%), and while some higher harmonics can be seen, I suspect that these are actually mathematical artifacts of the analysis. The picture didn't change into 600 ohms (not shown), and even the intermodulation products from a full-scale mix of 19 and 20kHz tones into this punishing load (fig.13) remained below -80dB (0.01%).
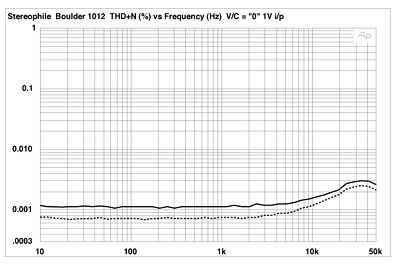
Fig.11 Boulder 1012, V/C = "0," analog input, THD+N (%) vs frequency at 1V input.
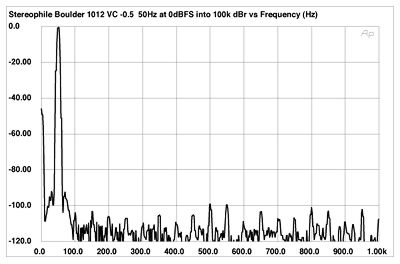
Fig.12 Boulder 1012, V/C = "-0.5," spectrum of 50Hz sinewave, DC-1kHz, at 0dBFS into 100k ohms (linear frequency scale).
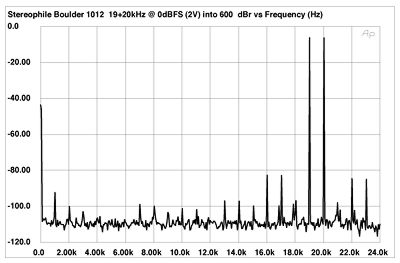
Fig.13 Boulder 1012, HF intermodulation spectrum, DC-24kHz, 19+20kHz at 0dBFS, 2V output into 600 ohms (linear frequency scale).
This tolerance for low load impedances can also be seen in fig.14, which plots the THD+noise percentage into 100k ohms and 600 ohms. The maximum output level hardly changes with the drastic reduction in load. However, with its very high gain, the phono stage has curtailed overload margins referred to the standard MC output of 500µV at 1kHz. I measured just under 11dB across most of the audioband, this increasing slightly to 12.4dB at 20Hz.
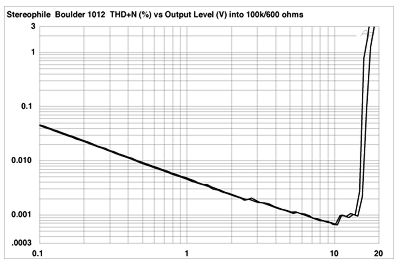
Fig.14 Boulder 1012, analog input, THD+N (%) vs output level into 100k ohms (right) and 600 ohms (left).
I used the Miller Audio Research Analyzer to assess the rejection of word-clock jitter of the Boulder's digital input. This program, based on a National Instruments PC card, works in conjunction with a 16-bit diagnostic signal stored on a CD-R with low timebase error. The software performs a high-resolution spectral analysis—64 averages of a 32,768-point FFT—of the player's analog output with the special signal, then searches the FFT "bins" for symmetrical sideband pairs. Because the PC card accepts only a single-ended input, I looked at just the "hot" phase of the Boulder's balanced output; it should be borne in mind that the balanced behavior might be different.
The result with the 1012 driven by my usual PS Lambda transport is shown in fig.15. The ultimate noise floor is about 3dB higher than the best CD playback hardware I have measured. More important, the peak-peak jitter was 3.6 nanoseconds—20 times greater than the best jitter-rejecting components—and consisted almost entirely of strong data-related sidebands at ±2756Hz (red, circled "15" markers), the 12th harmonic of the lower of the signal frequencies. A number of noise spikes, regularly spaced by 195Hz, can also be seen, these marked with blue numbers. I have no idea what these are due to, but perhaps there is some interaction between the analog circuits and the 1012's digital "housekeeping" circuitry. Certainly I would suspect this behavior as being behind Jonathan's finding some of the "midrange magic" offered by his reference components to be lost when the Boulder was used via its digital inputs.
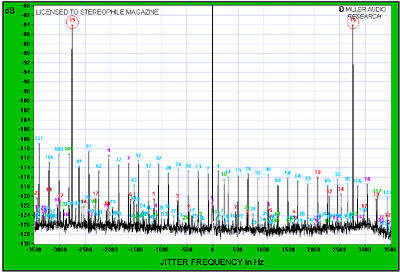
Fig.15 Boulder 1012, high-resolution jitter spectrum of unbalanced analog output signal, PS Lambda source (11.025kHz at -6dBFS with LSB toggled at 229Hz). Center frequency of trace, 11.025kHz; frequency range, ±3.5kHz.
In most respects, the Boulder 1012's measured performance was beyond reproach. Its wide dynamic range, vanishingly low distortion, and ability to drive low impedances are admirable. But the high level of word-clock jitter came as a surprise, and I would like to have seen less overall gain, with correspondingly increased overload margins and S/N ratios, on the phono input.—John Atkinson
|
|
| ||||||||||
- Log in or register to post comments


| Loudspeakers Amplification Digital Sources | Analog Sources Accessories Featured | Music Columns Retired Columns | Show Reports | Features Latest News Community | Resources Subscriptions |
 © 2024 Stereophile
AVTech Media Americas Inc., USA
All rights reserved

