| Columns Retired Columns & Blogs |
Between the Ears: the art and science of measuring headphones Page 4
Whoever wrote that must live in a fantasy world. Many of the headphones currently available in the hi-fi market have a medium nominal impedance of 30–60 ohms and typically display a quite wide variation of impedance with frequency. Fig.7 shows overlaid graphs of modulus of impedance vs frequency for the four aforementioned headphones, and fig.8 a simulation of the effect of using them with a source impedance of 120 ohms. The model with the largest impedance variation, the AKG K530 (orange trace), would suffer a total response error of almost 5dB.
Footnote 6: This depends on the amplifier having an output impedance across the audioband that is, at most, a small fraction of an ohm. There are some amplifiers, particularly tube amplifiers, that fail this criterion, sometimes spectacularly—such as the ridiculous PrimaLuna ProLogue Four that passed through my hands and proved to have an output impedance in excess of 30 ohms below 2kHz.
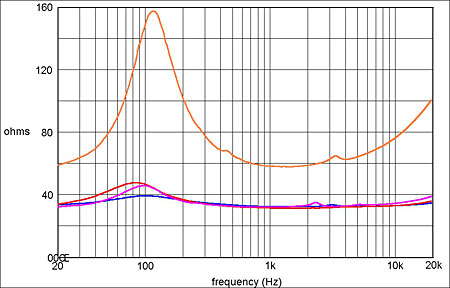
Fig.7 Superimposed impedance modulus vs frequency graphs for the four headphones listed in fig.5.
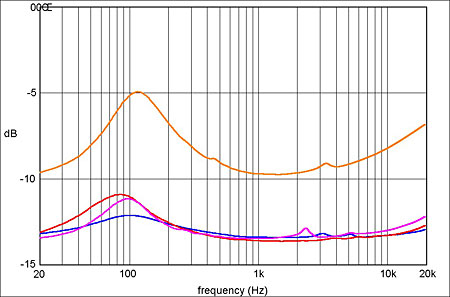
Fig.8 How the impedance plots of fig.7 translate into frequency-response errors for a source impedance of 120 ohms.
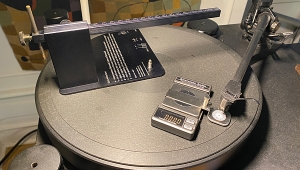
So far as measuring headphone frequency response is concerned, this effect is easily eliminated by determining the electrical response at the headphone input terminals and subtracting it from the acoustic response. This is good practice when measuring loudspeakers too, although errors due to finite amplifier output impedance are generally much less with speakers than with headphones (footnote 6). Fig.9 shows the less than elegant but effective means I use to achieve this, comprising two adapters: a ¼" stereo jack plug to twin ¼" stereo jack socket adapter, into one socket of which is inserted the headphone under test, and into the other a ¼" stereo jack plug to twin mono phono adapter, which provides the feeds to measure the terminal response on each channel.
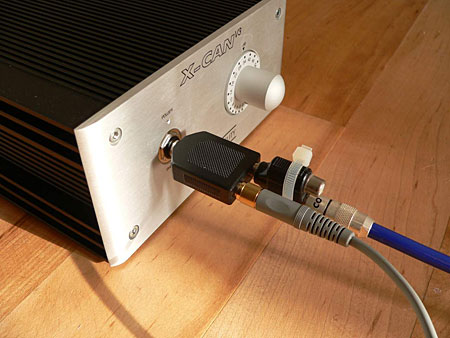
Fig.9 The use of adapters to measure headphone terminal responses.
The ramifications for subjective assessment of headphones are more troublesome because it is usually unclear what assumptions the manufacturer has made regarding source impedance. Was the headphone designed assuming near-zero source impedance, typical headphone-amp source impedance (inasmuch as there is such a thing), or the 120 ohms suggested by the IEC? Without knowing this, it's impossible to be sure that you're experiencing the intended tonal balance, except in the case of those high-impedance 'phones that have essentially constant modulus across the audible frequency range. In light of this uncertainty, I keep two different headphone amplifiers on hand for listening assessments: the latest version (v8) of Musical Fidelity's X-CAN, which, in response to my findings, has a specified 2 ohm output impedance; and the PS Audio GCHA, which has an output impedance of 44 ohms.
While this helps me assess headphones in the circumstances most favorable to them, this is clearly a crazy situation that the audio industry needs to address. It is manifestly unacceptable that a customer should select a pair of headphones by careful listening at a retailer, only to experience a quite different tonal balance at home due to a different source impedance. As things stand now, to ensure consistent results, headphones and headphone amplifiers need to be considered as a package.
Reflections
Another potential headphone measurement problem, and a somewhat surprising one, is the influence of room reflections. Although you might expect headphones to be immune to room effects, the fact is that open-backed models radiate sound into the room, and reflected sound finds its way back through the diaphragm—as fig.10 shows. In all the headphones I have measured to date, the reflections are sufficiently attenuated not to cause a problem in practice. But that may not be the case with electrostatic models, whose diaphragms provide negligible attenuation across the entire frequency range. Whatever, this is an effect to bear in mind, suggesting that the artificial ear be placed as far as possible from reflecting surfaces.
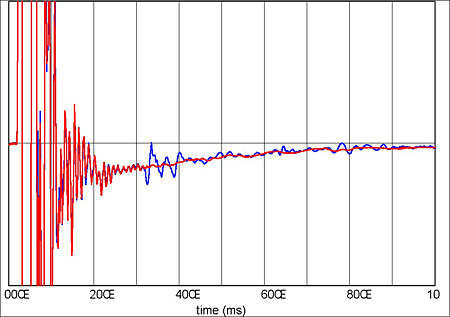
Fig.10 Superimposed impulse responses, zoomed in amplitude, for a Sennheiser HD650 headphone measured close to a wall (blue trace) and far from the wall (red), showing the influence of the wall reflection.
A more serious issue in most cases is the problem of repeatability, which has various aspects. Fig.11 shows, superimposed, the frequency responses obtained in five consecutive one-shot measurements of one capsule of a Sennheiser HD-650, which was untouched during the measurements. Above 100Hz the responses overlap almost exactly, as we would hope, but at lower frequencies the disparities become progressively larger until, at 18.4Hz, the largest difference is 2.7dB. Remember that the headphone has not been moved during these measurements, so the errors must be due to the presence of low-frequency environmental sounds.
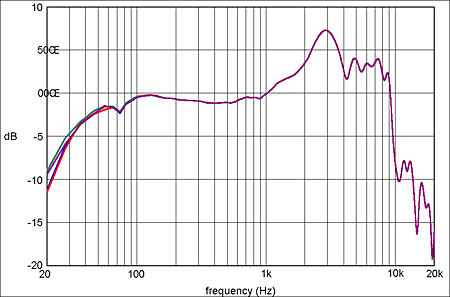
Fig.11 Five consecutive one-shot frequency-response measurements, superimposed, of a Sennheiser HD650 headphone.
If we repeat the five response runs but this time remove and replace the headphone between each, we obtain a result such as that shown in fig.12. The bass disparity is now even larger, and differences are clearly visible above 100Hz, particularly beyond 4kHz. While the increased bass errors might be caused by differences in earpad sealing between runs, this should not be an issue with a flat-plate cheek simulator and careful headphone placement, so it may, again, be solely due to environmental noise. The errors at higher frequencies clearly result from small changes in the positioning of the headphone relative to the artificial ear, which we would expect to be mirrored in normal use.
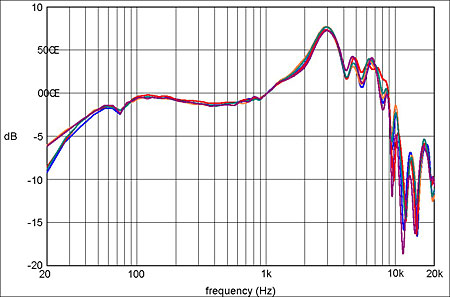
Fig.12 As in fig.11, but with the headphone removed from and replaced on the artificial ear after each measurement.
Going one stage further, by removing and replacing the pinna as well between each of the five response runs, results in the responses shown in fig.13. Now the disparities above 4kHz are even larger, indicating that the pinna cannot be removed and replaced with absolute consistency any more than can the headphone itself. This suggests that, unless the two capsules of a headphone are clearly "handed," it is better to measure both using the same pinna rather than religiously using a left pinna for the left capsule and a right pinna for the right capsule, as this only introduces further measurement variability.
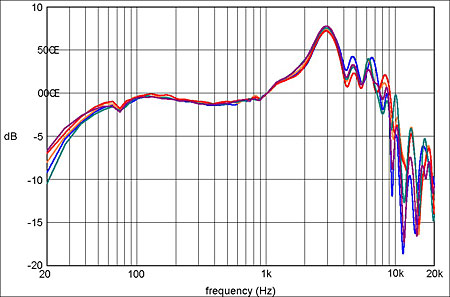
Fig.13 As in fig.12, but with the artificial pinna also removed and replaced after each measurement.
The use of signal averaging and response averaging can be used to generate more consistent measurements, of course, but to my mind it is not acceptable to brush these variations under the carpet by publishing only the averaged response. My preferred approach is to use standard statistical methods to generate 95% confidence intervals to either side of the mean response, to indicate where the errors occur and how large they are. If we adopt this approach for the responses shown in figs.11–13 we obtain figs.14–16, respectively, which may not look as definitive but are certainly more honest.
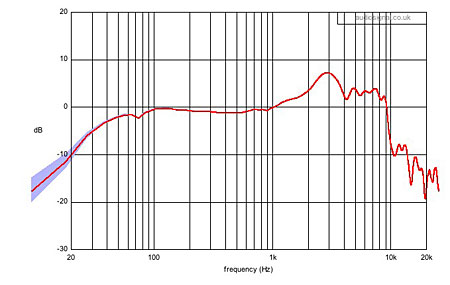
Fig.14 Averaged response of the five traces in fig.11 with the 95% confidence interval (shaded light blue).
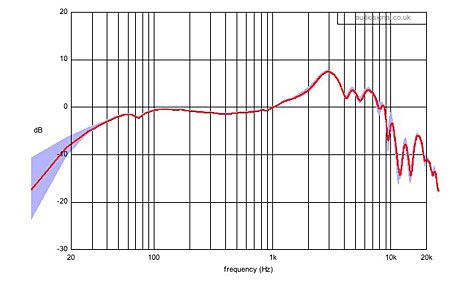
Fig.15 Averaged response of the five traces in fig.12 with the 95% confidence interval (shaded light blue).
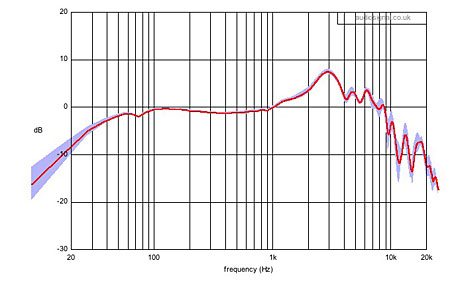
Fig.16 Averaged response of the five traces of fig.13 with the 95% confidence interval (shaded light blue).
All told, measuring headphones is a challenge very different from measuring loudspeakers, but it encompasses at least as many mysteries. Much of a headphone's sound quality clearly resides in its frequency response, but what that response should look like remains unclear. I'm hoping that amassing measurements and comparing them with subjective assessments will eventually bring enlightenment.
Footnote 6: This depends on the amplifier having an output impedance across the audioband that is, at most, a small fraction of an ohm. There are some amplifiers, particularly tube amplifiers, that fail this criterion, sometimes spectacularly—such as the ridiculous PrimaLuna ProLogue Four that passed through my hands and proved to have an output impedance in excess of 30 ohms below 2kHz.
|
| |||||||||
- Log in or register to post comments


| Loudspeakers Amplification Digital Sources | Analog Sources Accessories Featured | Music Columns Retired Columns | Show Reports | Features Latest News Community | Resources Subscriptions |
 © 2024 Stereophile
AVTech Media Americas Inc., USA
All rights reserved

