| Columns Retired Columns & Blogs |
Benchmark ADC1 USB A/D converter Measurements
Sidebar 3: Measurements
To examine how the Benchmark ADC1 USB performed on the test bench, I used Stereophile's loan sample of the top-of-the-line Audio Precision SYS2722 system (see www.ap.com and the January 2008 "As We See It"). I analyzed the AES/EBU output data in the digital domain, then repeated some measurements using the USB connection and Vinyl Studio running on my MacBook Pro, examining the resultant AIFF files with Adobe Audition's FFT analyzer.
The high specified input impedance of 200k ohms from 20Hz to 20kHz was confirmed by my measurements. The ADC1 preserved absolute polarity, the input XLRs being wired with pin 2 hot. With gain set to "0," an input of 1kHz at 1V resulted in a digital level of –22.08dBFS, meaning that 12.7V or 24.3dBu would be required for 0dBFS. Switching the gain to "10" increased the digital level by just over 10dB, to –12.03dBFS. With the gain set to "20," the 1V input resulted in a digital level of –2.04dBFS; ie, an accurate increase in gain of 10dB. In each case, the front-panel metering was accurate.
Fig.1 shows the ADC1 USB's frequency response at sample rates of 44.1, 96, and 192kHz. With each rate, the audioband response is flat to 20kHz, with a sharp rolloff as expected just below the Nyquist Frequency (half the sample rate). Channel separation at 20kHz (not shown) was superb, if somewhat asymmetrical, at >120dB R–L and >92dB L–R. The R–L crosstalk dropped below the noise floor below 2kHz, but below 200Hz in the other direction.
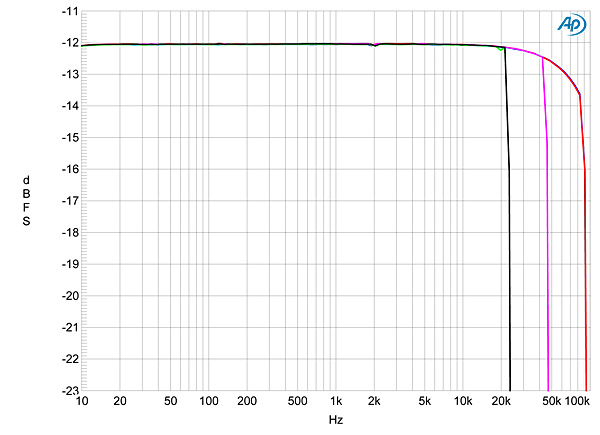
Fig.1 Benchmark ADC1 USB, frequency response at –12dBFS with data sampled at: 192kHz (left channel blue, right red), 96kHz (left cyan, right magenta), 44.1kHz (left green, right gray) (1dB/vertical div.).
Many A/D converters produce relatively high levels of distortion with input signals much above –6dBFS. However, even with a 1kHz tone at an input level equivalent to –1dBFS, all the distortion harmonics lay below –112dB (0.00025%), with the third the highest in level (fig.2). With the input signal reduced to –20dBFS, the only distortion that can be seen is at the residual level in the Audio Precision's generator (fig.3). The individual components of the noise floor in these graphs lies below –154dBFS, implying resolution of at least 20 bits, which is superb.
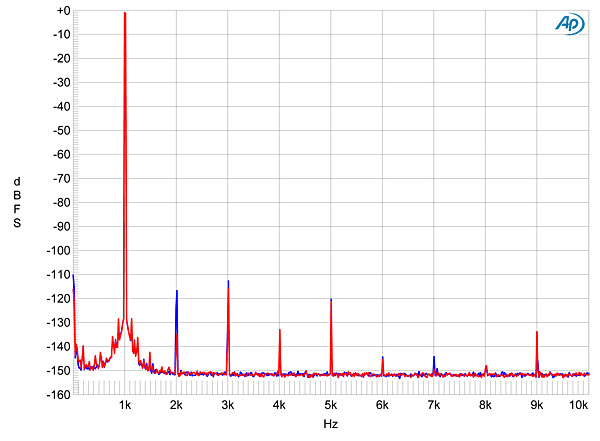
Fig.2 Benchmark ADC1 USB, FFT-derived spectrum, DC–10kHz, of 1kHz tone at –1dBFS, sampled at 48kHz with 24-bit word length and gain set to "10" (left channel blue, right red).
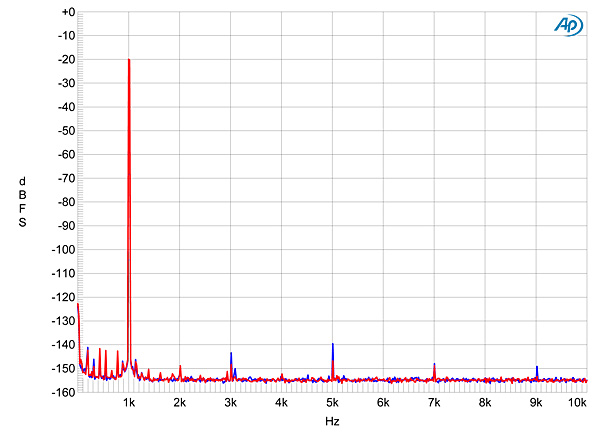
Fig.3 Benchmark ADC1 USB, FFT-derived spectrum, DC–10kHz, of 1kHz tone at –20dBFS, sampled at 48kHz with 24-bit word length and gain set to "10" (left channel blue, right red).
Some low-level spectral spreading of the spike that represents a high-level 20kHz tone can be seen in fig.4. This graph was taken at a sample rate of 96kHz; the spectra were identical at 48 and 192kHz. All had a tone present at 11.03kHz, admittedly at a very low level of –132dBFS. Extending the measurement bandwidth to 100kHz (fig.5) reveals another tone, at 28.97kHz, implying that these two tones, symmetrically placed at ±9870Hz with respect to the signal frequency, might be jitter related. There are also pairs of sidebands at ±4500 and ±2160Hz, both pairs at or below –140dBFS. But a high-level 20kHz tone is very much the worst case for exciting jitter; I am confident in claiming that, at their extremely low level, these sidebands will have no effect on sound quality.
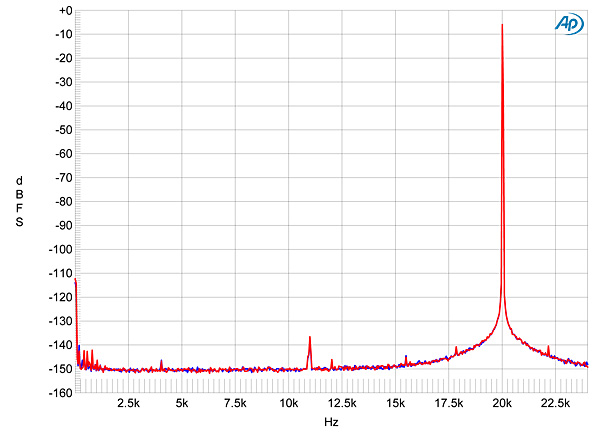
Fig.4 Benchmark ADC1 USB, FFT-derived spectrum, DC–24kHz, of 20kHz tone at –6dBFS, sampled at 96kHz with 24-bit word length and gain set to "10" (left channel blue, right red).
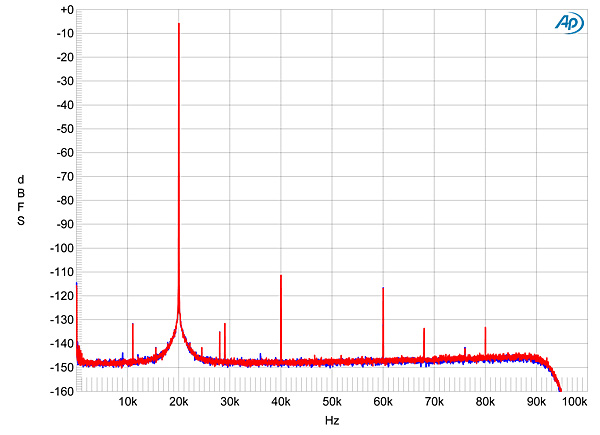
Fig.5 Benchmark ADC1 USB, FFT-derived spectrum, DC–100kHz, of 20kHz tone at –6dBFS, sampled at 192kHz with 24-bit word length and gain set to "10" (left channel blue, right red).
Overall, this is superb measured performance.—John Atkinson
|
| ||||||||||
- Log in or register to post comments


| Loudspeakers Amplification Digital Sources | Analog Sources Accessories Featured | Music Columns Retired Columns | Show Reports | Features Latest News Community | Resources Subscriptions |
 © 2024 Stereophile
AVTech Media Americas Inc., USA
All rights reserved

