| Columns Retired Columns & Blogs |
I was looking for copyright and/or patent info on "Streamlength" and found none (only a TM).
Please reply with more info on this issue as necessary. Thx!
I examined the measured behavior of the Ayre Acoustics QB-9 (footnote 1) using the Audio Precision SYS2722 system (see www.ap.com and "As We See It" in the January 2008 issue), as well as, for some tests, my Audio Precision System One Dual Domain. I drove the QB-9 with the USB 2.0 output of my Intel MacBook running OS10.4.11 for the testing, playing back WAV files using Bias Peak 6.2. Unlike iTunes, Peak interacts with the OSX CoreAudio engine to ensure that audio at the correct sample rate is sent out through the USB and FireWire ports; nevertheless, I double-checked using the AudioMidi setup utility. And bless you, Ayre, for including a sample-rate indicator on the QB-9's front panel, to provide a final confirmation that all was well. To avoid problems of noise contamination, I ran the MacBook on battery power for the testing, and used a premium USB cable from Belkin.
The QB-9 successfully decoded audio data with sample rates of 44.1, 48, 88.2, and 96kHz. The maximum output level was to specification, at 4.12V RMS from the balanced XLR jacks, 2.06V from the unbalanced RCAs. Both outputs preserved absolute polarity—ie, were non-inverting—with the XLRs wired with pin 2 hot. The source impedance from the unbalanced jacks was a low 71 ohms at all audio frequencies, and twice that figure from the balanced jacks, as expected.
A rear-panel DIP switch allows the QB-9's digital reconstruction filter to be set two different ways, which Ayre calls Listen and Measure. Measure is said to resemble the minimum-phase "apodizing" filter used by Meridian in their 808i.2 CD player, which I reviewed in April; the Listen filter has been optimized by Ayre's engineering team to give much of the benefit of the apodizing filter, but with less ringing. For reference, fig.1 shows the impulse response (footnote 2) of a D/A processor that uses a conventional linear-phase digital reconstruction filter. Ringing can be seen both preceding and following the impulse; the former is unnatural and is said by some researchers to be one reason for so-called "digital" sound. Fig.2 shows the QB-9's impulse response set to Measure. All the ringing now follows the impulse, though it is, overall, higher in level than in fig.1. It is indeed similar to the Meridian 808i.2's impulse response (fig.2 in that review). Fig.3 shows the QB-9's Listen impulse response; again, there is no ringing before the impulse, but there are just two cycles of ringing after it, and these are well damped.
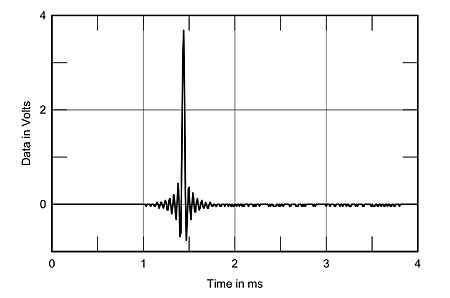
Fig.1 Benchmark DAC1, response to single sample at 0dBFS, 44.1kHz sampled data (4ms time window).
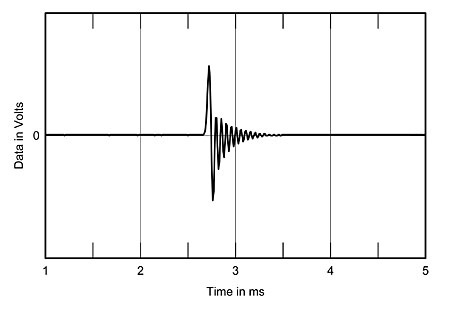
Fig.2 Ayre Acoustics QB-9 set to Measure, response to single sample at 0dBFS, 44.1kHz sampled data (4ms time window).
There is no free lunch in engineering—the Listen filter's better time-domain behavior has been obtained at the expense of a slower degree of rolloff in the frequency domain than either the fig.1 or fig.2 filter, and, as a result, less rejection of ultrasonic content at and above the Nyquist Frequency (half the sample rate). The bottom pair of traces in fig.4 show the QB-9's frequency response with data sampled at 44.1kHz. The Measure filter starts to roll off in the top audio octave, reaching –1.7dB at 20kHz before dropping like a stone by 22.05kHz. The Listen filter starts to roll off a little earlier, but is down just 6dB at 22.05kHz, meaning that it will not completely eliminate a recording's pre-ringing that had been introduced by the original A/D converter. The top traces in fig.4 show the QB-9's behavior with 96kHz-sampled data; other than the fact that the rolloffs begin just over an octave higher than with CD data, the behavior is very similar. The Ayre's channel separation (not shown) was superb at >116dB in both directions below 2kHz, and still 100dB at 20kHz.

Fig.3 Ayre Acoustics QB-9 set to Listen, response to single sample at 0dBFS, 44.1kHz sampled data (4ms time window).

Fig.4 Ayre Acoustics QB-9, frequency response at –12dBFS into 100k ohms with 44.1kHz data (bottom traces) and with data at 96kHz (top, right channel dashed; 1dB/vertical div.). In both cases, the upper pair of traces above 10 and 25kHz were with the Measure filter, the lower traces with Listen.
For consistency with my previously published tests of digital components, I first examine resolution by sweeping a 1/3-wide bandpass filter from 20kHz to 20Hz while the device under test decodes dithered data representing a 1kHz tone at –90dBFS. The top pair of traces in fig.5 show an analysis of the QB-9's balanced output with 16-bit data. The peak just touches the –90dB line, implying minimal linearity error, and other than a slight bump in the left channel's output at 120Hz, the noise floor is actually the dither noise used to encode the signal.
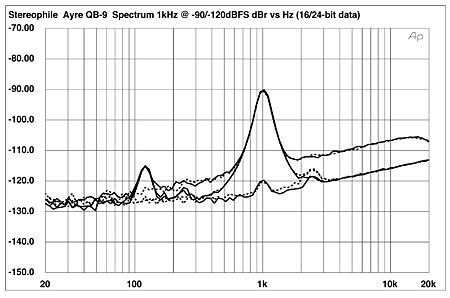
Fig.5 Ayre Acoustics QB-9, 1/3-octave spectrum with noise and spuriae of dithered 1kHz tone at –90dBFS with 16-bit data (top), 24-bit data (middle at 2kHz), and of dithered 1kHz tone at –120dBFS with 24-bit data (bottom at 1kHz). (Right channel dashed.)
Increasing the word length to 24 bits gave the middle pair of traces in fig.5. The noise floor has dropped by 10dB, implying resolution of around 18 bits, and the bump at 120Hz in the left channel has been joined by smaller bumps at 180 and 240Hz, suggesting that these are power-supply–related. But at –116dB and below, this behavior will have no subjective consequences. The drop in the noise floor has unmasked a bump in the traces between 2 and 3kHz, which is a little higher in the right channel than the left. I have no idea what this might be due to, however. Finally, the bottom pair of traces in this graph indicate that the QB-9 can resolve a tone at –120dBFS.
Figs. 6 and 7 are FFT-derived analyses of the QB-9's output with dithered 1kHz data at –90dBFS with 16- and 24-bit data, respectively. The low-level, power-supply–related spuriae in the left channel can again be seen, but there is no sign of anything that might have given rise to the small bump centered at 2.5kHz in fig.5.

Fig.6 Ayre Acoustics QB-9, FFT-derived spectrum with noise and spuriae of dithered 1kHz tone at –90dBFS with 16-bit CD data (left channel blue, right red).
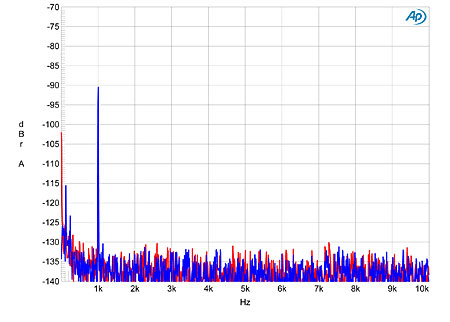
Fig.7 Ayre Acoustics QB-9, FFT-derived spectrum with noise and spuriae of dithered 1kHz tone at –90dBFS with 24-bit data (left channel blue, right red).
The plot of the Ayre's linearity error against absolute level with 16-bit data showed only the effect of the recorded dither noise, so I haven't shown it. With 24-bit data, the error was minimal down to –110dB, but there was a couple of dB's worth of negative error below –120dBFS. Fig.8 shows the waveform of an undithered 16-bit/1kHz tone at exactly –90.31dBFS—the three discrete DC voltage levels described by the data are clearly resolved, with excellent waveform symmetry. Increasing the data's bit depth to 24 gives rise to a well-defined sinewave (fig.9).
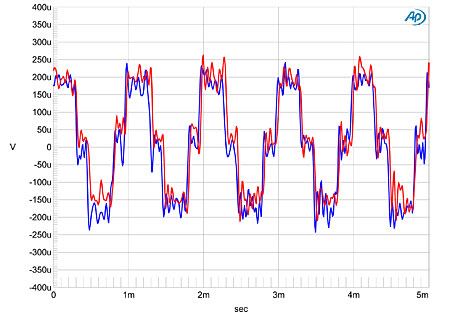
Fig.8 Ayre Acoustics QB-9, waveform of undithered 1kHz sinewave at –90.31dBFS, CD data (left channel blue, right red).

Fig.9 Ayre Acoustics QB-9, waveform of undithered 1kHz sinewave at –90.31dBFS, 24-bit data (left channel blue, right red).
The QB-9's output stage offers low distortion, with the highest-level harmonics accompanying a full-scale tone (fig.10) being the third, at –84dB (0.006%), and the second, at –90dB (left, 0.003%) and –97dB (right, 0.0014%); both harmonics are subjectively innocuous, and would remain so even at much higher levels. This graph was taken into the benign 100k ohms load; dropping the load impedance to 600 ohms (fig.11) brings the third harmonic up to –70dB (0.03%), and introduces the fifth harmonic at just under –90dB. Obviously, the QB-9 is having to work hard with this wickedly demanding load, but the distortion is still low.
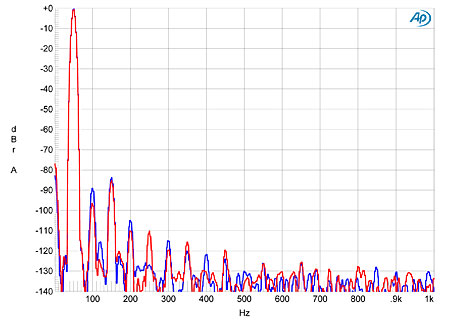
Fig.10 Ayre Acoustics QB-9, spectrum of 50Hz sinewave at 0dBFS into 100k ohms, 24-bit data (left channel blue, right red; linear frequency scale).
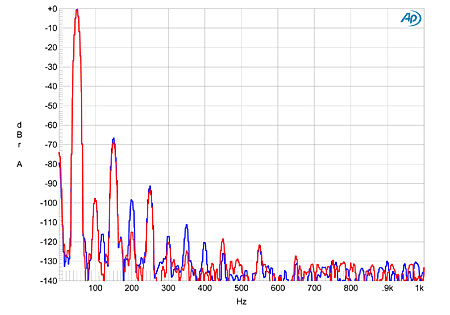
Fig.11 Ayre Acoustics QB-9, spectrum of 50Hz sinewave at 0dBFS into 600 ohms, 24-bit data (left channel blue, right red; linear frequency scale).
Set to Measure, the QB-9 offered respectable performance on the high-frequency intermodulation test, even into 600 ohms (fig.12). Intermodulation products from the 19 and 20kHz tones are all below –80dB (0.01%), and while the reconstruction filter lets through a couple of images, at 24.1kHz and 25.1kHz (44.1 minus 20kHz and 44.1 minus 19kHz, respectively), these lie at or below –92dB. The picture is a little different with the QB-9 set to Listen (fig.13). While actual intermodulation products are still very low in level, the less steep rolloff that goes with the optimized time-domain performance allows many more aliased images to "leak" into the audioband. The primary images, at 24.1 and 25.1kHz, now lie just 9dB below the original tones, and other images are visible in the audioband itself. Fortunately, these all lie close to –100dB or below, and the Ayre processor is actually much better behaved in this respect than the more extreme filter settings offered by the dCS Scarlatti, which Michael Fremer reviewed in August (see fig.12 on p.66 of that issue).

Fig.12 Ayre Acoustics QB-9 set to Measure, HF intermodulation spectrum, 19+20kHz at 0dBFS peak into 600 ohms, 24-bit data (left channel blue, right red; linear frequency scale).

Fig.13 Ayre Acoustics QB-9 set to Listen, HF intermodulation spectrum, 19+20kHz at 0dBFS peak into 600 ohms, 24-bit data (left channel blue, right red; linear frequency scale).
Finally, I assessed the QB-9's susceptibility to jitter by decoding 16- and 24-bit files carrying the Miller/Dunn test signal, which comprises a high-level tone at one-quarter the sample rate and a low-level squarewave at 1/192 the sample rate, the latter created by toggling the LSB on and off. Conventional USB DACs do badly on this test, but the asynchronous USB mode developed by Gordon Rankin and used in the QB-9, which slaves the host computer to the DAC, works well. Fig.14 shows a narrowband FFT analysis of the QB-9's output signal when fed 16-bit data: the central spike, which represents the 11.025kHz tone, is narrow and well defined, suggesting that there are no low-frequency random variations in sample–sample timing, and what can be seen of the squarewave harmonics are at the residual level. The left channel (blue trace) is better behaved than the right (red), which has low-level sidebands present at the power-supply–rated frequency of ±120Hz. Even so, the QB-9 performs significantly better than, for example, the Cambridge DacMagic (see fig.12 in that review), which has a conventional USB input. The asynchronous USB mode works as advertised.
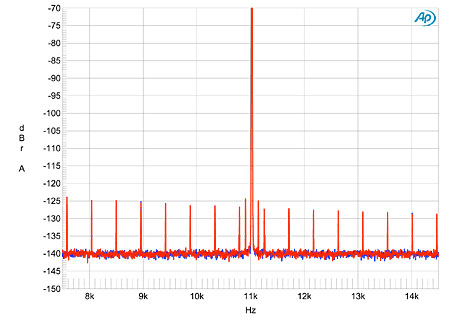
Fig.14 Ayre Acoustics QB-9 set to Measure, high-resolution jitter spectrum of analog output signal, 11.025kHz at –6dBFS, sampled at 44.1kHz with LSB toggled at 229Hz, 16-bit data. Center frequency of trace, 11.025kHz; frequency range, ±3.5kHz (left channel blue, right red).
Overall, Ayre's QB-9 is well engineered, offering excellent performance in both the analog and digital domains, and is not compromised by its having just a USB data input. Speaking personally, because I use many different digital sources, I would have liked to have seen a second S/PDIF or AES/EBU input, but I am sure this would have made the QB-9 significantly more expensive.—John Atkinson
Footnote 2: To plot the impulse-response graphs in this review, I created a WAV file that contained two closely spaced impulses, each comprising a single full-scale positive sample. I captured the QB-9's output using a digital oscilloscope that lacked an input antialiasing filter, so that the 'scope digitizer's own impulse response would not obscure the behavior of the DACs under test. I used two pulses so that the first would trigger the 'scope and the second would appear in the middle of the display.
|
|
| ||||||||||

I was looking for copyright and/or patent info on "Streamlength" and found none (only a TM).
Please reply with more info on this issue as necessary. Thx!


| Loudspeakers Amplification Digital Sources | Analog Sources Accessories Featured | Music Columns Retired Columns | Show Reports | Features Latest News Community | Resources Subscriptions |
 © 2024 Stereophile


