| Columns Retired Columns & Blogs |
Avalon NP Evolution 2.0 loudspeaker Measurements
Sidebar 3: Measurements
Footnote 1: These two sets of measurements were taken about three weeks apart, so I was gratified to see the very close correspondence between the traces in the treble. Repeatability in a measurement is an under-appreciated necessity.—John Atkinson
My estimate of the Avalon NP Evolution 2.0's voltage sensitivity on its tweeter axis was 91dB(B)/2.83V/m, which is both significantly higher than average and a little higher than the specified 90dB. This is a speaker that will play loudly with very few amplifier watts. Specified as having a 4 ohm impedance, the NP 2.0's impedance does drop to just below 4 ohms in the lower midrange (fig.1). There is also a combination of 5 ohms and –45² electrical phase angle at 95Hz, a frequency where music can have a lot of energy. So even if a powerful amplifier isn't necessary to drive the Avalon to satisfyingly high levels, it should still be one that has no problems driving low impedances.

Fig.1 Avalon NP Evolution 2.0, electrical impedance (solid) and phase (dashed). (2 ohms/vertical div.)
A small wrinkle at 375Hz in the impedance traces suggests the presence of a cabinet resonance of some kind at that frequency. Examining the panels' vibrational behavior with a simple plastic-tape accelerometer, I did find a strong resonance on the top and rear panels at 375Hz. The highest-level mode, however, lay at 332Hz on the side panels (fig.2). Not only could this mode be strongly heard with a stethoscope, it also could be heard as a faint hoot from the listening position when I played the half-step–spaced tonebursts from Stereophile's Editor's Choice CD. It is probable, therefore, that this behavior gave rise to the feeling that both midrange piano notes and male speaking voice suffered a little from excessive overhang.

Fig.2 Avalon NP Evolution 2.0, cumulative spectral-decay plot calculated from the output of an accelerometer fastened to the center of the sidewall 10" from the base (MLS driving voltage to speaker, 7.55V; measurement bandwidth, 2kHz).
The saddle at 33Hz between the two low-frequency impedance peaks in fig.1 implies that that is the tuning frequency of the rear-firing reflex port. The port's output, measured in the nearfield (fig.3, red trace), does indeed broadly peak between 20 and 50Hz. However, its output is lower than necessary to fully extend the speaker's bass output to the port tuning frequency, and the minimum-motion notch in the woofers' output (fig.3, blue trace) occurs slightly lower in frequency. Though there is a slight exaggeration of the woofers' response in this graph, this is certainly due to the nearfield measurement technique used to plot the drive-units' outputs below 350Hz. The Avalon's low frequencies are on the lightweight side, though the nature of the reflex tuning will favor articulation over boom.

Fig.3 Avalon NP Evolution 2.0, anechoic response on tweeter axis at 50", averaged across 30² horizontal window and corrected for microphone response, with the nearfield responses of the woofers (blue) and port (red), plotted in the ratios of the square roots of their radiating areas below 300Hz and 800Hz, respectively, and the complex sum of the nearfield responses plotted below 300Hz (black).
Higher in frequency in fig.3, the twin woofers have identical outputs (black trace), and their combined response gently rises, reaching a small peak at 1.6kHz, before crossing over to the tweeter around 2kHz. This peak gives rise both to the NP 2.0's slightly nasal character and to its superb retrieval of recorded detail. The level of the tweeter appears to match the lower midrange rather than the upper midrange; it is well behaved in its passband, above which its fundamental dome resonance gives rise to a strong peak at 25kHz—which, not coincidentally, is the frequency of a slight discontinuity in the impedance traces.
I examined the effect of the grille by taking the in-room response above 300Hz on the tweeter axis at 36" with (fig.4, green trace) and without (blue trace) the grille. The difference made by adding the grille, offset by –20dB for clarity, is shown in red. The grille does three things: It adds a little bit of energy in the two octaves above the peak at 1.6kHz; it slightly suppresses the speaker's output above 10kHz; and it introduces a significant notch in the mid-treble. The latter appears to be due to reflections of the tweeter's output from the grille interfering with the direct sound from the drive-unit.

Fig.4 Avalon NP Evolution 2.0, anechoic response on tweeter axis at 36" above 300Hz, with (green) and without (blue) grille, plus the difference made by adding the grille (red), offset by –20dB for clarity.
As I found in my auditioning, the degree of upper-midrange "character" in the Avalon's sonic signature could be adjusted by experimenting with room placement and toe-in. This can be explained by looking at the speaker's plot of lateral dispersion without the grilles (fig.5): the relatively large-diameter woofers get quite directional in the exact region of the on-axis peak, which can be made to work against the peak's audibility. The tweeter becomes quite directional at a lower frequency than normal; the NP 2.0 might sound a little too mellow in very large rooms, or in smaller rooms with overdamped acoustics. In the vertical plane (fig.6), a sharply defined suckout appears at the crossover frequency for listening axes above the tweeter, which is a fairly low 33.5" from the floor. This, too, might ameliorate the effect of the on-axis peak.

Fig.5 Avalon NP Evolution 2.0, lateral response family at 50", normalized to response on tweeter axis, from back to front: differences in response 90–5² off axis, reference response, differences in response 5–90² off axis.

Fig.6 Avalon NP Evolution 2.0, vertical response family at 50", normalized to response on tweeter axis, from back to front: differences in response 15–5² above axis, reference response, differences in response 5–10² below axis.
I measured the Avalons' spatially averaged response at my listening position, without the grilles, both with my initial setup (fig.7, blue trace) and with Gary Mulder's subsequent setup (fig.7, red trace, footnote 1). My technique for this measurement is to take 40 FFT-derived responses for each speaker individually in a rectangular grid 36" wide by 18" high and centered on the position of my ears in my listening seat. (I use SMUG Software's Fuzzmeasure v.2 program running on my Apple laptop, in conjunction with a calibrated Earthworks omnidirectional microphone and a Metric Halo FireWire-connected audio interface.) The Avalons' bass is usefully extended by my room's lowest-frequency mode, at around 30Hz, but the lower-midrange and low-frequency regions can be seen to be shelved down by 3dB or so. The gentle rolloff between 5 and 10kHz is mainly due to the increasing absorption of the room furnishings in this region.
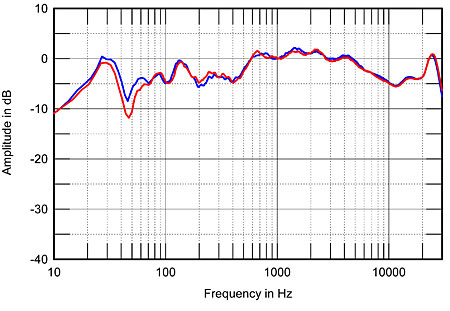
Fig.7 Avalon NP Evolution 2.0, spatially averaged, 1/6-octave response without grilles in JA's listening room, as set up by JA (blue) and by Avalon's Gary Mulder (red).
Considering the large difference I heard between the two setups, the measured difference is relatively small. The greatest difference can be seen in the bass, where the closer-to-the-sidewalls speaker positions I had chosen gave more midbass energy. By contrast, Gary Mulder's positions resulted in very slightly more lower-midrange energy and an even slighter reduction in the height of the 1.6kHz peak. Even so, these changes effected a disproportional reduction in the nasality that had been bothering me.
For reference, fig.8 shows the spatially averaged in-room response of the Epos M16is, which I used for comparison. While the peak at 125Hz and dip at 48Hz are very similar to those in the Avalon plot—they are due to room-acoustics effects that have not been eliminated by the spatial averaging— the British speakers' low frequencies are overall smoother and just as extended as the Americans'. More important, the Eposes produce more lower-midrange energy in-room than the Avalons, which is why male voices sounded more robust through them. The M16is' top two octaves are higher in level, however, which is why the Avalons sounded slightly more mellow. (The room response for the PSB Synchrony One, with which I also compared the Avalon, can be seen here.)

Fig.8 Epos M16si, spatially averaged, 1/6-octave response in JA's listening room.
In the time domain, the NP 2.0's step response on the tweeter axis (fig.9) indicates that all three drive-units are connected with positive acoustic polarity and that the tweeter's output leads the woofers' by 300µs or so. Its step is smoothly integrated with that of the woofers, however, confirming the optimal crossover configuration. Other than some low-level delayed energy at the top of the woofer passband, the Avalon's cumulative spectral-decay plot (fig.10) is clean, confirming the speaker's grain-free highs.

Fig.9 Avalon NP Evolution 2.0, step response on tweeter axis at 50" (5ms time window, 30kHz bandwidth).

Fig.10 Avalon NP Evolution 2.0, cumulative spectral-decay plot on tweeter axis at 50" (0.15ms risetime).
The Avalon NP Evolution 2.0's measurements revealed two areas of weakness—that lively cabinet and the nonflat low treble—as well as some positive attributes, such as the clean waterfall plot and the well-controlled low frequencies. But there is nothing in the NP 2.0's measured performance that reveals how it manages to throw that enormous soundstage.—John Atkinson
Footnote 1: These two sets of measurements were taken about three weeks apart, so I was gratified to see the very close correspondence between the traces in the treble. Repeatability in a measurement is an under-appreciated necessity.—John Atkinson
|
|
| ||||||||||
- Log in or register to post comments


| Loudspeakers Amplification Digital Sources | Analog Sources Accessories Featured | Music Columns Retired Columns | Show Reports | Features Latest News Community | Resources Subscriptions |
 © 2024 Stereophile
AVTech Media Americas Inc., USA
All rights reserved

