| Columns Retired Columns & Blogs |
Audio Research VTM200 monoblock power amplifier Measurements
Sidebar 3: Measurements
I made sure the bias currents had all been properly set after an hour's warmup before I started testing the Audio Research VTM200. The amplifier was non-inverting and appeared to be wired with pin 2 of its XLR jack wired as "hot," the modern convention. Its input impedance was a very high 185k ohms and its voltage gain into 8 ohms measured a high 30.2dB from the 16 ohm output-transformer tap, 27.5dB from the 8 ohm tap, and a low 24.8dB from the 4 ohm tap. Its output impedance also varied according to which tap was used: a reasonably low 0.35 ohm from the 4 ohm tap, rising to 0.6 ohm from the 8 ohm tap and 1 ohm from the 16 ohm tap.
As a result, there will be a moderate amount of interaction between the VTM200's source impedance and the manner in which a loudspeaker's load impedance varies with frequency. This can be seen in fig.1, which shows the frequency response measured at the 8 ohm output driving both resistive loads and our simulated two-way loudspeaker load. The response varies by ±0.45dB with the latter, decreasing to ±0.3dB with the 4 ohm tap but increasing to ±0.65dB from the 16 ohm tap. These variations will all be audible.
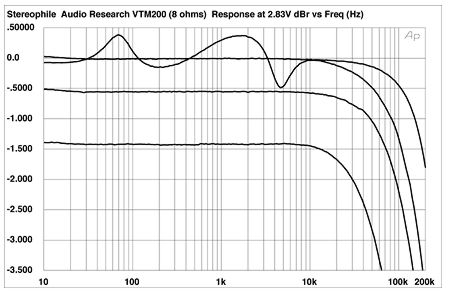
Fig.1 Audio Research VTM200 (8 ohm tap), frequency response at (from top to bottom at 2kHz): 2.83V into dummy loudspeaker load, 1W into 8 ohms, 2W into 4 ohms, and 4W into 2 ohms (0.5dB/vertical div.).
Fig.1 shows that the response extends to very high frequencies for a tube amplifier, the output from the 8 ohm transformer tap being just 1.75dB down at 200kHz, a tribute to the designer of the amplifier's transformer. This decreased to -1.2dB at 200kHz from the 4 ohm tap and increased to -3.2dB from the 16 ohm tap. Accordingly, the VTM200's reproduction of a 10kHz squarewave (fig.2) featured very short risetimes. The 1kHz squarewave (not shown) was ideally square in shape, without a hint of overshoot.
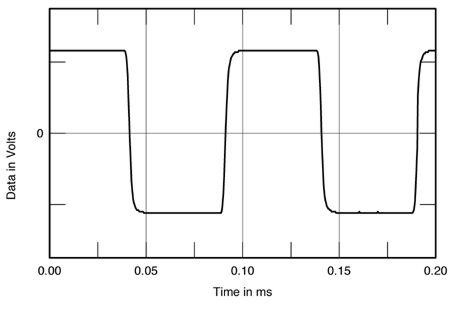
Fig.2 Audio Research VTM200, small-signal 10kHz squarewave into 8 ohms.
The A-weighted signal/noise ratio (ref. 1W into 8 ohms) was superb at 95dB, although this did decrease to a still excellent 83.2dB with a wideband, non-weighted measurement. Distortion levels were also low, but increased with transformer tap impedance and the greater the degree of mismatch between that tap and the load. Fig.3, for example, shows the small-signal THD+noise percentage plotted against frequency from the 8 ohm tap. The distortion into 8 ohms is below 0.1% over most of the audioband, rising slightly in the top two octaves (as is often the case with amplifiers using only moderate amounts of loop negative feedback). Note that each halving of the load impedance doubles the level of distortion. However, with the simulated load, which has an impedance often well above 8 ohms, the distortion drops to 0.02% at times, which suggests that the output-transformer tap should be chosen to match the lowest impedance of the user's speaker rather than its average impedance.
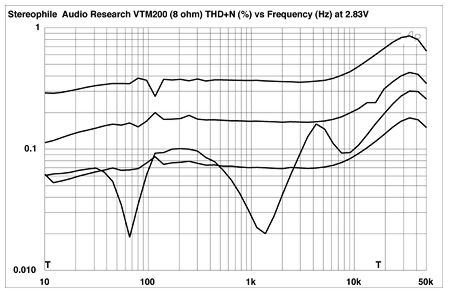
Fig.3 Audio Research VTM200 (8 ohm tap), THD+noise (%) vs frequency at (from top to bottom at 2kHz): 4W into 2 ohms, 2W into 4 ohms, 1W into 8 ohms, and 2.83V into simulated loudspeaker load.
The lowest distortion overall was achieved from the 4 ohm tap. Fig.4, taken at 2.7W into 4 ohms, with just 0.06% of THD, shows that the distortion under these circumstances was primarily second harmonic. Fig.5 reveals that as the load impedance drops below the nominal tap impedance, third and higher harmonics appear. (The distortion level for this graph, taken at 8W into 4 ohms from the 16 ohm tap, was 0.28%.) This is confirmed by fig.6, a spectral analysis of the 4-ohm tap output at 69W into 4 ohms. Some AC-supply components can also be seen in this graph, though these are at low levels. The 1kHz difference component with the demanding 19+20kHz twin-tone test (fig.7) was higher than I'd expected, at 0.2%, and the spectral lines are a little "furry," perhaps from power-supply components. The RMS power level for this graph was 90W into 4 ohms from the 4 ohm tap (just below the onset of visible clipping on an oscilloscope).
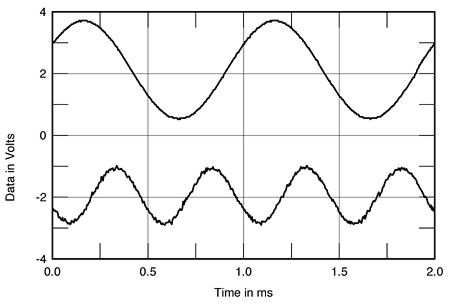
Fig.4 Audio Research VTM200 (4 ohm tap), 1kHz waveform at 2.7W into 4 ohms (top), distortion and noise waveform with fundamental notched out (bottom, not to scale).
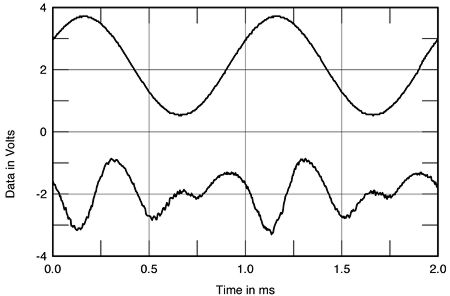
Fig.5 Audio Research VTM200 (16 ohm tap), 1kHz waveform at 8W into 4 ohms (top), distortion and noise waveform with fundamental notched out (bottom, not to scale).
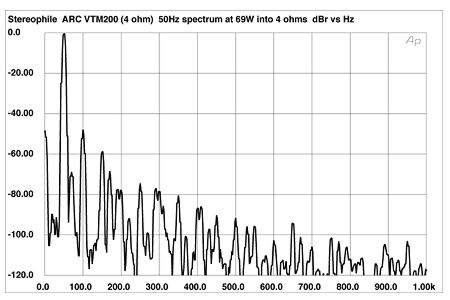
Fig.6 Audio Research VTM200 (4 ohm tap), spectrum of 50Hz sinewave, DC-1kHz, at 69W into 4 ohms (linear frequency scale).

Fig.7 Audio Research VTM200 (4 ohm tap), HF intermodulation spectrum, DC-24kHz, 19+20kHz at 90W into 4 ohms (linear frequency scale).
Audio Research emphasizes that the VTM200 must be driven in balanced mode. I checked what happened to the distortion when the amplifier was driven with an unbalanced signal via an RCA-to-XLR adapter—it went through the roof!
Finally, as the VTM200's balanced speaker output was not happy with the Miller Audio Research Amplifier Profiler's unbalanced and grounded input, I tested the amplifier's output power only with continuous sinewave drive. Figs.8, 9, and 10, taken from the 16 ohm, 8 ohm, and 4 ohm output-transformer taps, respectively, show that the VTM200 slightly exceeds its specified power at our standard 1% THD+N "clipping" point, provided the tap is exactly matched to the load. (Ignore the "sawtooth" effect in these graphs, which is due to the Audio Precision System One's autoscaling.)
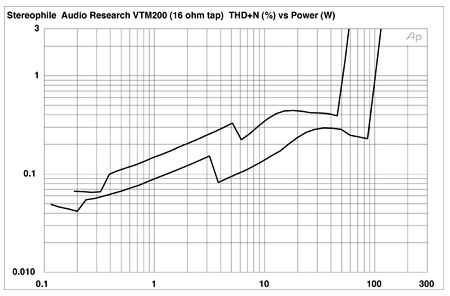
Fig.8 Audio Research VTM200 (16 ohm tap), distortion (%) vs continuous output power into (from bottom to top at 10W): 8 ohms and 4 ohms.
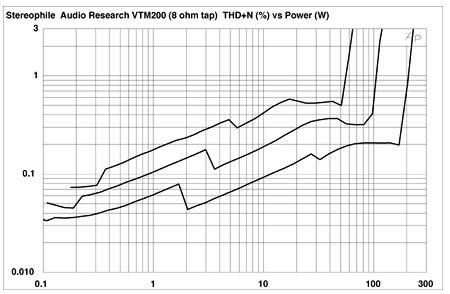
Fig.9 Audio Research VTM200 (8 ohm tap), distortion (%) vs continuous output power into (from bottom to top at 10W): 8 ohms, 4 ohms, and 2 ohms.
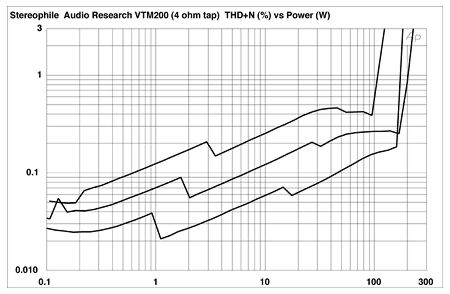
Fig.10 Audio Research VTM200 (4 ohm tap), distortion (%) vs continuous output power into (from bottom to top at 10W): 8 ohms, 4 ohms, and 2 ohms.
All in all, this is respectable measured performance from a modern tube amplifier design. There is no real indication of why MF found it fussy with respect to cables, or why both of us found its balance to lie on the bright side of neutral.—John Atkinson
NEXT: Manufacturer’s Comment »
|
| ||||||||||
- Log in or register to post comments


| Loudspeakers Amplification Digital Sources | Analog Sources Accessories Featured | Music Columns Retired Columns | Show Reports | Features Latest News Community | Resources Subscriptions |
 © 2024 Stereophile
AVTech Media Americas Inc., USA
All rights reserved

