| Columns Retired Columns & Blogs |
Apogee Electronics Groove D/A headphone amplifier Measurements
Sidebar 3: Measurements
Footnote 1: My measurements were different from those published by Tyll Hertsens on our sister site InnerFidelitycom.
I measured the Apogee Groove with my Audio Precision SYS2722 system (see www.ap.com and the January 2008 As We See It"). The source was USB from my 2012 MacBook Pro running on battery power. Macintosh's USB Prober utility reported the Groove's product string as "Groove" from "Apogee," and confirmed that its USB port operated in the optimal isochronous asynchronous mode. Apple's AudioMIDI utility confirmed that the Groove operated at all sample rates from 44.1 through 192kHz with 24-bit integer data.
The Groove preserved absolute polarity (ie, was non-inverting) and with the volume control set to its maximum, the maximum output level was 5.05V RMS, which is much higher than expected from a device working on 5V USB bus power. Although Apogee describes the Groove's output impedance as variable and depending on the load, I measured a value of 21 ohms at all audio frequencies into loads ranging from 20 to 600 ohms (footnote 1). With 44.1kHz data, the Groove's impulse response (fig.1) revealed the DAC's reconstruction filter to be a conventional linear-phase, FIR type. Wideband spectral analysis of the Apogee's output as it decoded data representing 44.1kHz-sampled white noise at –4dBFS (fig.2, red and magenta traces, footnote 2) indicated that the reconstruction filter featured a steep rolloff above the Nyquist frequency (half the sample rate), reaching the stopband by 24kHz. As a result, the aliased image at 25kHz of a full-scale 19.1kHz tone (blue and cyan traces) was suppressed by more than 110dB. The distortion harmonics of this tone are also low in level.
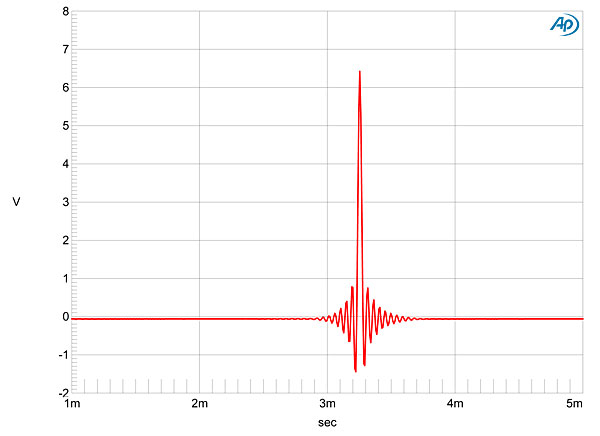
Fig.1 Apogee Groove, impulse response at 44.1kHz (4ms time window).
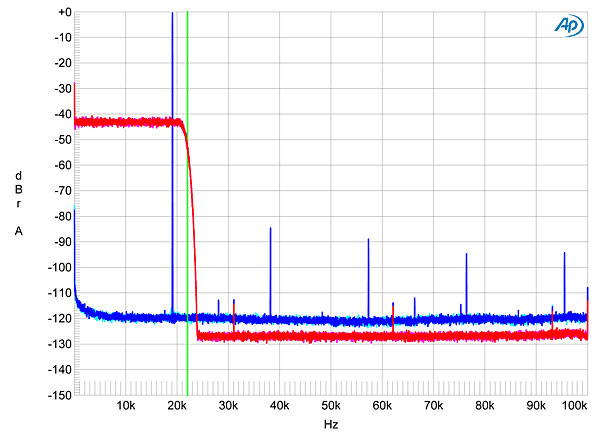
Fig.2 Apogee Groove, wideband spectrum of white noise at –4dBFS (left channel red, right magenta) and 19.1kHz tone at 0dBFS (left blue, right cyan), with data sampled at 44.1kHz (20dB/vertical div.).
Fig.3 shows the Groove's frequency response with data sampled at 44.1, 96, and 192kHz. The responses at the two lower rates follow the same gentle rolloff above 20kHz, with the expected sharp drop in output just below each Nyquist frequency. With 192kHz data, the rolloff steepens above 60kHz, reaching –3dB at 90kHz. Crosstalk between the channels was extremely low, at better than –100dB in both directions below 1.5kHz, though the usual capacitive coupling decreased the separation to 80dB at the top of the audioband.
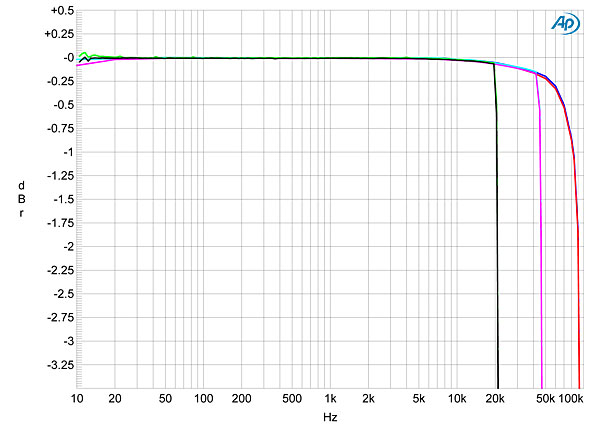
Fig.3 Apogee Groove, frequency response at –12dBFS into 100k ohms with data sampled at: 44.1kHz (left channel green, right gray), 96kHz (left cyan, right magenta), 192kHz (left blue, right red) (0.dB/vertical div.).
The Apogee Groove performed extremely well with my usual test for resolution, which is to feed the DAC first dithered 16-bit data representing a 1kHz tone at –90dBFS, then 24-bit data representing the same signal. Fig.4 reveals that the increase in bit depth drops the noise floor by 20dB, implying that the Groove has >19-bit resolution. With 24-bit data (blue and red traces), however, there is a small but nonetheless puzzling rise in noise centered on 2.5kHz. With undithered 16-bit data representing a tone at exactly –90.31dBFS (fig.5), the three voltage levels described by the data are very well defined, with excellent waveform symmetry and zero DC offset. With undithered 24-bit data (fig.6), the Groove output a clean sinewave.
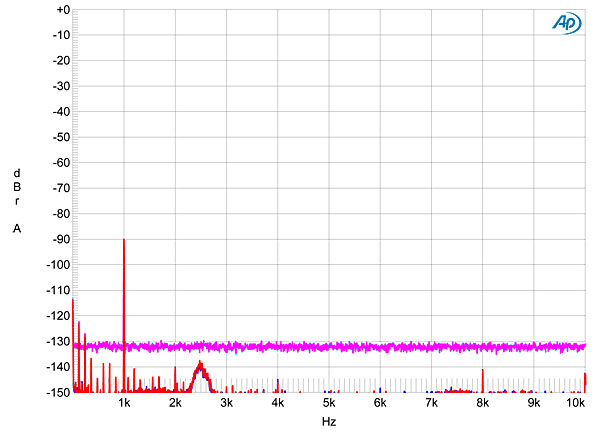
Fig.4 Apogee Groove, spectrum with noise and spuriae of dithered 1kHz tone at –90dBFS with: 16-bit data (left channel cyan, right magenta), 24-bit data (left blue, right red) (20dB/vertical div.).
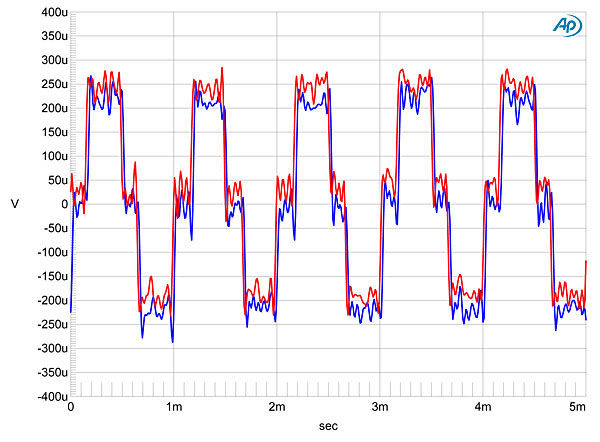
Fig.5 Apogee Groove, waveform of undithered 1kHz sinewave at –90.31dBFS, 16-bit data (left channel blue, right red).
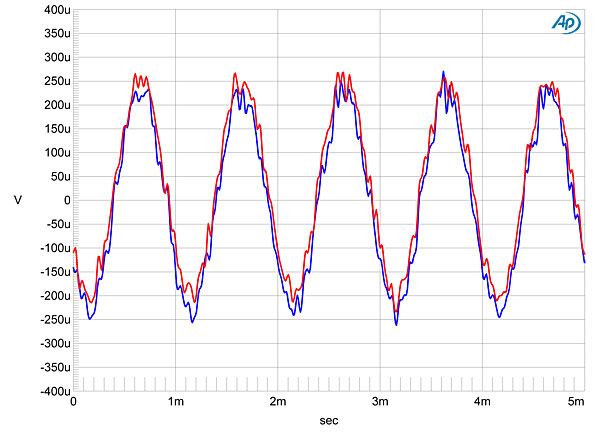
Fig.6 Apogee Groove, waveform of undithered 1kHz sinewave at –90.31dBFS, 16-bit data (left channel blue, right red).
Measured into 300 ohms, the Apogee Groove exhibited very low levels of harmonic (fig.7) and intermodulation (fig.8) distortion. Note, however, that in fig.8 the small rise in noise floor at 2.5kHz can again be seen, with slightly greater rises centered on 6 and 27kHz, and another small rise at 8kHz. I have no idea what caused this behavior or if it will have any effect on sound quality, though the small rise at 8kHz can also be seen in the spectral analysis of the DAC's output as it decoded 16-bit J-Test data (fig.9). However, the odd-order harmonics of the low-frequency, LSB-level squarewave are all at the correct levels (green line), and no other sidebands can be seen. With 24-bit data, the result was essentially perfect (fig.10), though the small rise in the noise floor at 8kHz is still evident.
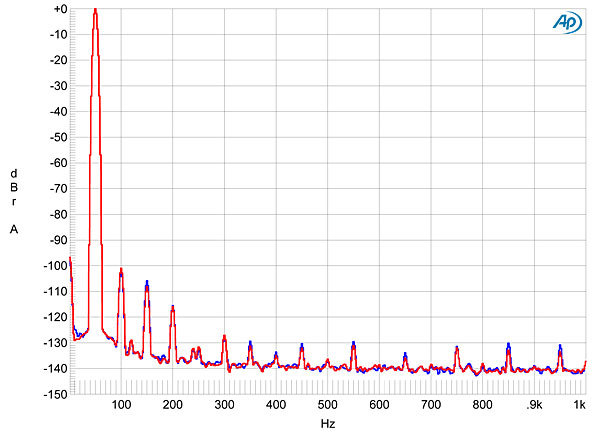
Fig.7 Apogee Groove, spectrum of 50Hz sinewave, DC–1kHz, at 0dBFS into 300 ohms (left channel blue, right red; linear frequency scale).
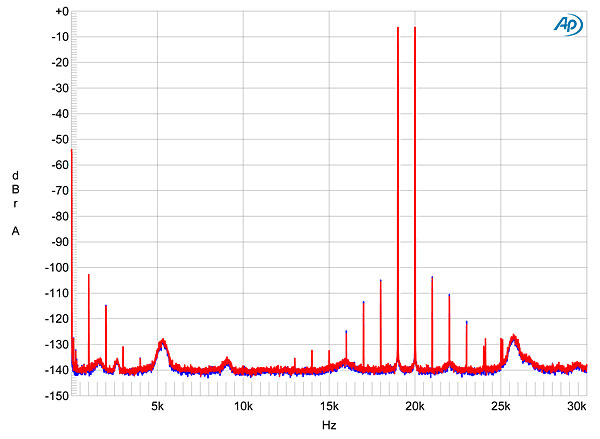
Fig.8 Apogee Groove, HF intermodulation spectrum, DC–30kHz, 19+20kHz at 0dBFS into 300 ohms, 44.1kHz data (left channel blue, right red; linear frequency scale).
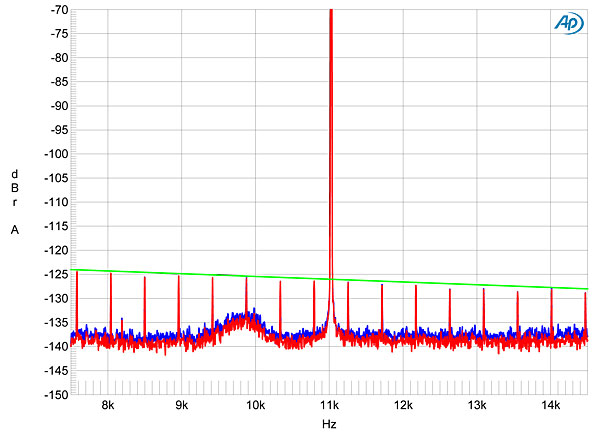
Fig.9 Apogee Groove, high-resolution jitter spectrum of analog output signal, 11.025kHz at –6dBFS, sampled at 44.1kHz with LSB toggled at 229Hz: 16-bit data via USB (left channel blue, right red). Center frequency of trace, 11.025kHz; frequency range, ±3.5kHz.
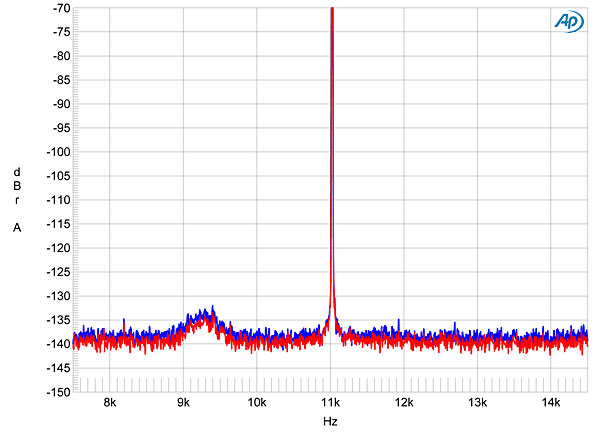
Fig.10 Apogee Groove, high-resolution jitter spectrum of analog output signal, 11.025kHz at –6dBFS, sampled at 44.1kHz with LSB toggled at 229Hz: 24-bit data via USB (left channel blue, right red). Center frequency of trace, 11.025kHz; frequency range, ±3.5kHz.
Overall, the Apogee Groove offers superb measured performance, which is even more impressive when you consider that it costs less than $300!—John Atkinson
Footnote 1: My measurements were different from those published by Tyll Hertsens on our sister site InnerFidelitycom.
Footnote 2: This test was suggested to me by Jürgen Reis, chief engineer of MBL.
|
|
| ||||||||||
- Log in or register to post comments


| Loudspeakers Amplification Digital Sources | Analog Sources Accessories Featured | Music Columns Retired Columns | Show Reports | Features Latest News Community | Resources Subscriptions |
 © 2024 Stereophile
AVTech Media Americas Inc., USA
All rights reserved

