| Columns Retired Columns & Blogs |
Acoustic Energy AE1 loudspeaker 1992 Measurements
Sidebar: 1992 Measurements
Fig.1 shows the AE1's electrical impedance magnitude and phase. The tuning of the twin ports lies at 53Hz, while the overall load will be kind to amplifiers, only dropping momentarily to 8 ohms in the lower midrange and remaining above 10 ohms for nearly all the audio band. This little speaker should be particularly well-suited to classic tube amplifiers, both due to its lack of a need for current and to the significantly smaller modification of its frequency response caused by the interaction between its load and the amplifier's source impedance. The jaggedness in the magnitude curve between 3 and 9kHz implies some sort of crossover equalization, perhaps to minimize the effect of a woofer cone-breakup mode, while the glitches at 470Hz and 26kHz imply the presence of strong resonances at these frequencies. While the latter is due to the tweeter's inaudible "oil-can" resonance, the lower-frequency resonance is probably due to a cabinet problem in this region (see below).

Fig.1 Acoustic Energy AE1, electrical impedance (solid) and phase (dashed). (2 ohms/vertical div.)
Fig.2 shows the individual responses of the two drive-units on the tweeter axis. The woofer shows a slight degree of peakiness just before it starts to roll out, while the tweeter is a little depressed in the top audio octave before its response takes off, due to the tweeter resonance which reaches a high +20dB at 26.3kHz. The woofer shows slight evidence of a peak at 4.7kHz, but this is well below the tweeter level at this frequency. Shown to the left of fig.3 are the individual responses of the woofer and one of the ports, taken in the nearfield. These curves confirm the port tuning frequency of 53Hz. (The peak in the port output almost coincide with the notch in the woofer output at the same frequency; in effect, the woofer is motionless at the port tuning frequency, all the speaker's acoustic output emanating from the ports. Above the port frequency, the woofer radiates in phase with the port, meaning that their outputs sum. Below it, the woofer is out of phase with the port, meaning that the combined rolloff is steeper than that of either on its own.)

Fig.2 Acoustic Energy AE1, acoustic crossover on tweeter-axis at 50", corrected for microphone response, with the nearfield woofer and port responses plotted below 300Hz and 500Hz, respectively.
The complex sum of the woofer and port responses is shown to the left of fig.3. The speaker is basically flat down to 65Hz, with then a steep rollout. The bass is 6dB down at 49Hz, just below the tuning frequency of the ports. To the right of fig.3 is shown the AE1's overall anechoic response on its tweeter axis, averaged across a 30 degree horizontal window. Again the region between 10kHz and 20kHz is depressed, this contributing to the speaker's "sweet" treble balance. But apart from a suckout centered on 5kHz, the midrange and treble are very flat overall. This suckout, too high in frequency to be a crossover artifact, is therefore probably geometric in nature.
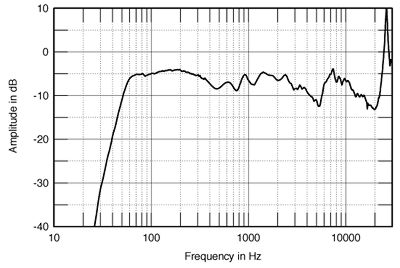
Fig.3 Acoustic Energy AE1, anechoic response on-axis at 50", averaged across 30 degrees horizontal window and corrected for microphone response, with the complex sum of the nearfield woofer and port responses plotted below 300Hz.
This is confirmed by fig.4, which shows how the speaker's balance changes as the listener moves further to the side of the tweeter axis. (Only the changes are shown in this graph, meaning that the on-axis response becomes a straight line.) The on-axis 5kHz depression fills in off-axis, though a gully appears below that frequency at extreme off-axis positions due to the woofer's increasing beaminess at the top of its passband. This suckout also fills in when the listener sits below the tweeter axis, as can be seen from fig.5, which shows the changes in balance to be expected in the vertical plane. Sit above the tweeter, however, and a large suckout appears in the low treble, confirming the Acoustic Energy's need for high stands.

Fig.4 Acoustic Energy AE1, lateral response family at 50", normalized to response on tweeter axis, from back to front: differences in response 90 degrees-5 degrees off-axis, reference response, differences in response 5 degrees-90 degrees off-axis.

Fig.5 Acoustic Energy AE1, vertical response family at 50", normalized to response on tweeter axis, from back to front: differences in response 10 degrees-5 degrees above axis, reference response, differences in response 5 degrees-10 degrees below axis.
How these quasi-anechoic MLSSA-derived measurements integrate in the listening room is shown in fig.6, which plots the combined 1/3-octave response of each speaker taken individually with an Audio Control analyzer in a 72"-wide by 24"-high window centered on the listening position. This spatial averaging both minimizes the effect of low-frequency room resonances and gives a reasonably accurate representation of the balance between the speaker's direct sound and the room reverberant field. The peaks at 63Hz and 160-200Hz in fig.6 are residual room modes which have not been completely removed by the averaging, while the dip between 250Hz and 500Hz is due to interference between the direct sound and its reflection from the floor, something which subjectively has little effect, due to the ear/brain tuning it out. Above the lower midrange, the AE1's in-room balance is remarkably smooth, with only a slight mid-treble emphasis correlating with the residual brightness noted during the auditioning, and an early top-octave rolloff—there's that treble sweetness—spoiling what would otherwise be a perfectly flat response. Here's the reason instrumental timbres generally sounded so natural and uncolored via the AE1.
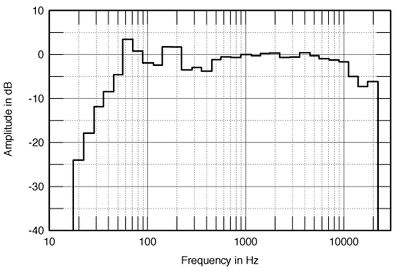
Fig.6 Acoustic Energy AE1, spatially averaged, 1/3-octave, free-field response in JA's later Santa Fe listening room.
NEXT: 1992 Measurements part 2 »
|
|
| ||||||||||
- Log in or register to post comments


| Loudspeakers Amplification Digital Sources | Analog Sources Accessories Featured | Music Columns Retired Columns | Show Reports | Features Latest News Community | Resources Subscriptions |
 © 2024 Stereophile
AVTech Media Americas Inc., USA
All rights reserved

