| Columns Retired Columns & Blogs |
Acoustat Spectra 11 loudspeaker Measurements
Sidebar 2: Measurements
Fig.1 shows the spatially averaged response of the Spectra 11s in my listening room. The overall balance can be seen to be rolled-off in the highs, with an excess of 4–5dB in the exact region covered by the woofer (35–300Hz). The apparently depressed HF, however, owes more to the limited dispersion of the Spectra 11's electrostatic panel in its top two octaves in both lateral and vertical planes. The on-axis response measures and sounds both flat and smooth to about 14kHz, with the exception of a degree of boost between 2kHz and 2.5kHz, though there is still a lack of top-octave air. In my addendum to Sam Tellig's discussion of the Spectra 11 in last month's "Anarchist" column, I conjectured that the elevated woofer level will be most likely due to the fact that the woofer radiation is effectively omnidirectional while the electrostatic panel has a bipolar, figure-eight dispersion pattern. This disparity will therefore be less pronounced in larger rooms.
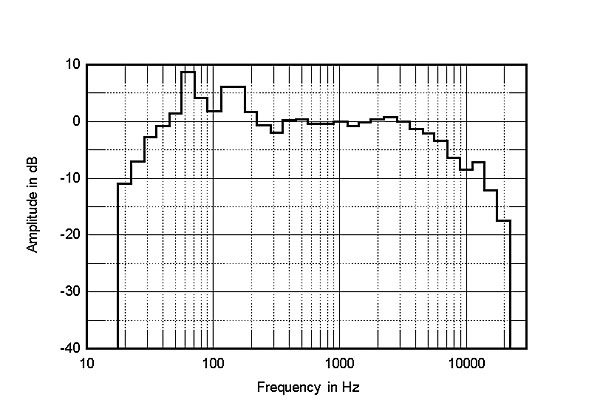
Fig.1 Acoustat Spectra 11, spatially averaged, 1/3-octave response in JA's listening room.
I measured the anechoic response of the 11 using Stereophile's new DRA Labs MLSSA system. The impulse response (taken with a 30kHz measurement bandwidth) on my normal 36"-high listening axis is shown in fig.2 while the step response is shown in fig.3. Fig.3 reveals that the time-coincident panel's output is in inverted polarity, while the woofer output is in positive polarity. The smooth blend between the two steps indicates optimal crossover design.
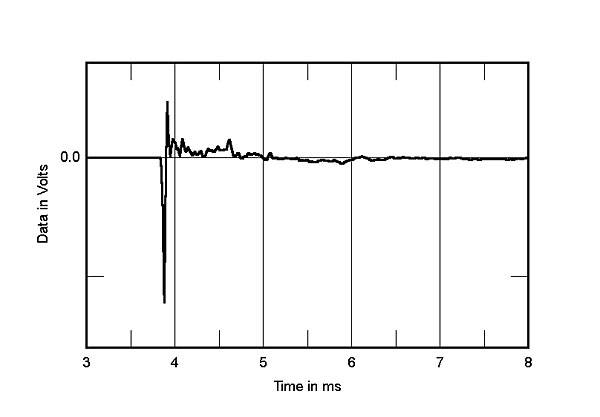
Fig.2 Acoustat Spectra 11, impulse response on tweeter axis at 48" (5ms time
window, 30kHz bandwidth).
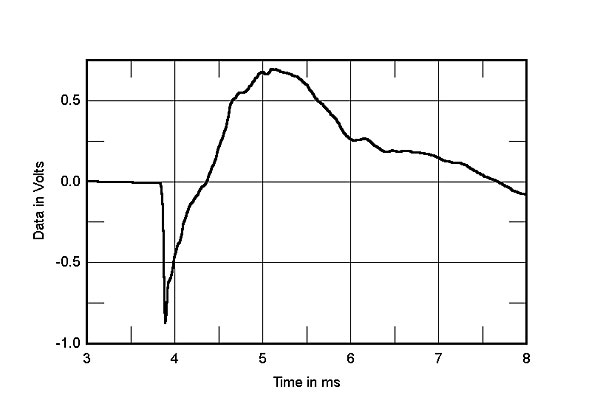
Fig.3 Acoustat Spectra 11, step response on tweeter axis at 48" (5ms time window, 30kHz bandwidth).
The equivalent anechoic response is shown on the right-hand side of fig.4: the overall trend above 1kHz is flat, though a lack of energy between 1 and 2kHz and a slight excess between 2 and 3kHz can be seen. The treble rolls off above 14kHz and is marred by numerous small peaks and dips, which are due either to innocuous interference or to subjectively more problematic resonances. The left-hand side of fig.4 shows the response of the woofer alone, measured in the nearfield. LF extension is good, the half-power point lying at 35Hz, below the lowest notes of the (four-string) double and electric basses.
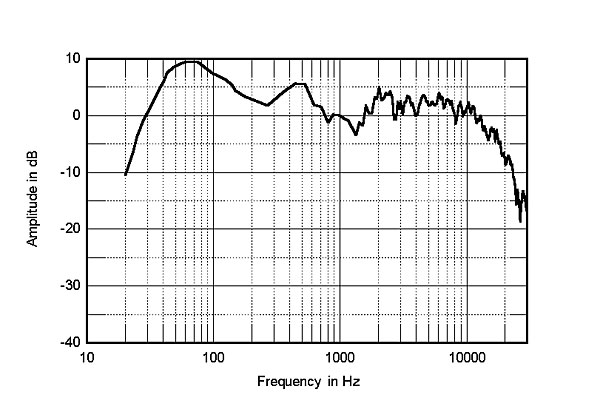
Fig.4 Acoustat Spectra 11, anechoic response on listening axis at 48", corrected for microphone response, with nearfield woofer response plotted below 300Hz.
Using MLSSA, I also explored the off-axis responses. The middle curve in fig.5 shows the response on my preferred axis, which was very high; 48" from the ground is above the head of a listener sitting in a normal chair. Comparing this curve with fig.4 shows that the lower treble is smoother on this axis, though the 10–12kHz region is now a little exaggerated in level, which might add subjective "air" to the sound on this axis. The other curves in fig.5 show the Spectra 11's response at the same height respectively 15° and 30° off-axis to the side. The speaker's output above the slight peak at 2.5kHz or so can be seen to increasingly shelve down as the listener moves to the side of the speaker, while the extreme highs are affected by what can only be interference effects. Though smooth, this limited dispersion implies that these speakers should either be listened to from at least 15' away (preferably in a live, underdamped room) if the sound is not to be too mellow; in a smaller room, Tiptoes should be used to tilt the speaker to aim the center of the panel at the listener's ears, in my opinion.
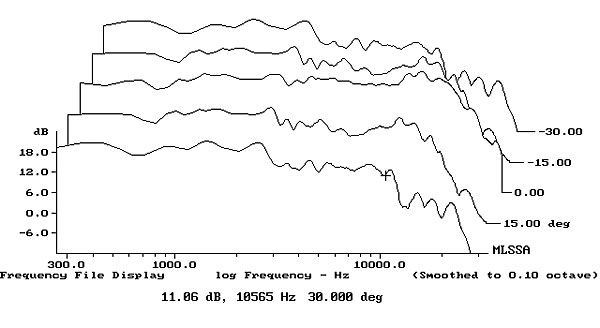
Fig.5 Acoustat Spectra 11, lateral response family at 48", from back to front: responses 30°–15° off axis, reference response on mid-panel axis, responses 15°–30&3176; off axis.
The post-processing power of MLSSA allows you to explore for the presence of delayed resonances. The classic three-dimensional "waterfall" display in fig.6, plotted from 300Hz to 30kHz, shows how the anechoic frequency response of the Spectra 11 on the "high" axis changes as the exciting impulse decays; resonances show up as ridges parallel to the time axis. (Note, however, that the frequency resolution below 500Hz is insufficient to reveal lower-midrange problems, due to the need to window the time-domain data to eliminate the effect of room reflections from the measurement.) The slight excess of energy noted in the in-room response can be seen to correlate with two strong resonant modes, at 2131 and 2575Hz. In my room, these were audible as added "bite" in the lower treble; I actually had to play around with both lateral and vertical listening axes to minimize their subjective effect (though I could never entirely eliminate it).
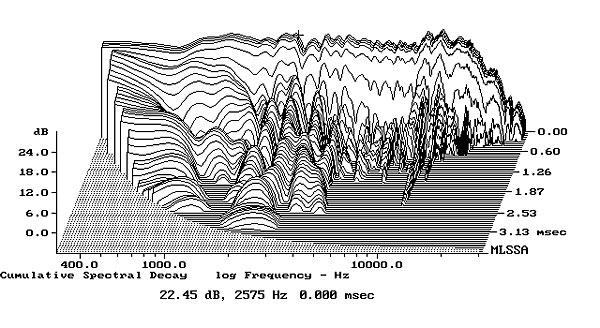
Fig.6 Acoustat Spectra 11, cumulative spectral-decay plot on tweeter axis at 48" (0.15ms risetime).
The top octave, though decaying rapidly in level (revealing the fast nature of the electrostatic driver), also features some mildly resonant behavior, though the strongest mode, at 16.6kHz, will be unlikely to annoy anyone except small children and dogs. The lower two, at approximately 10,450 and 12,350Hz, are less important, though they are most prominent—and audible—on this higher axis.
Finally, the Spectra 11's impedance (fig.7) was measured to assess how difficult a load it would present to an amplifier. The 11 ohm peak at 45Hz reveals the infinite-baffle woofer tuning, while the impedance drops to 5 ohms between 80 and 300Hz. Though it drops to 2 ohms above 10kHz, the Spectra 11 will be hardly likely to present inexpensive solid-state amplifiers with any problems.—John Atkinson
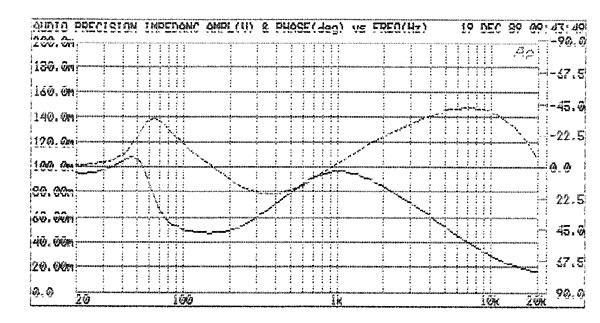
Fig.7 Acoustat Spectra 11, electrical impedance (solid) and phase (dashed) (2 ohms/vertical div.).
- Log in or register to post comments
