The Audio Society of Minnesota Conducts Cable Comparison Tests

Between listening sessions, cabled were switched.

Each monthly issue of Stereophile includes an updated calendar of all the different hi-fi events taking place across the United States. We also maintain this calendar on our Facebook Events page. One of the events that really caught our eye was the Blind Cable Comparison Tests performed by the Audio Society of Minnesota, which took place on Tuesday, April 17th. Here is the report as submitted by members of the Audio Society of Minnesota. The Society reported record crowds for this event. Hopefully, this spirit of questioning, discovery, and fun will spread to other audio events across the country

The Tests

The questions have vexed audiophiles for decades: Do speaker cables make a difference? Are expensive cables better than cheap cables? The Audio Society of Minnesota tackled these questions with a little experiment involving over 50 members and guests as our test group. As much as was possible under the circumstances, the experiment was set up as a blind test of four sets of cables (A, B, C, & D) ranging from cheap to expensive and tested in pair sets in the order shown below.

Test 1: A & B
Test 2: C & D
Test 3: B & D
Test 4: C & A
Test 5: B & C
Test 6: D & A
Test 7: A & C

Test 7 is a repeat of test 4 except that the order of cables was reversed.

Cable “A” was a 7ft pair of common 16ga zipcord terminated with hardware store copper spades. Approximate cost: less than $3.

Cable “B” was 6ft pair hollow tube design wrapped with an exotic copper winding and terminated with copper spades. Retail price in the $8000 range.

Cable “C” was a 15ft heavy gauge, complex twisted pair in rubber plenum terminated with gold plated copper spades. Price $1,200.

Cable “D” was a 6ft prototype silver cable in a Teflon jacket, 18ga twisted. Bare wire ends coated with solder. Price to be determined, but well over $1,000.

Blind tests were performed. The audience did not know how many cables were involved in testing. Cables were kept hidden behind the speakers and amplifiers. Preamp and amplifier levels were not adjusted during the tests or between tests. Seven separate listening tests pitted one unknown cable pair against a second unknown cable pair. The same 1 minute 50 second listening track consisting of various music selections was used in every test.

To assure proper connection between the amp and speakers, the listening began with a phase test, an “out of phase” male voice followed by an “in phase” voice. These short few seconds were taken from a Stereophile Test CD. The 5 second phase test was immediately followed by the opening 38 seconds of the “Firebird Suite” from the Reference Recordings Sampler with the Minnesota Orchestra with a short fade out. This was followed by 34 seconds of the beginning of Mark Knopfler’s “Shangri-La” from the same titled album, again with a short fade out. This was followed immediately by 33 seconds of Tracy Kent’s rendition of “You’re the Top”. This mix of music features demanding peaks from the Firebird, a well recorded male vocal and background, and a well recorded female vocal with Jazz trio and piano solo. Track mix was performed using Pro Tools and burned to disc in various formats. After private disc listening comparisons, the decision was made that the DVD-A 24/96 format was most faithful to the original track selections and was used for the tests.

For each of the seven comparison tests, the music track was played using the first pair of speaker cables, a pause for cable switching (20 to 35 seconds), followed by the same track using the second pair, followed by cable switching, followed by a music track using the first pair a second time, more cable switching, then the second pair a second time.

After two repetitions of cable switching, test #1 concluded and the audience was asked to mark sheets with votes indicating the listener’s preferred cable. They were asked to rate the cables on bass, midrange, treble, and overall preference. An option was also given to indicate a “no preference” vote in each of the categories. The audience was informed that cable “winners” would only be based on the “overall” preference votes. The remaining six tests were conducted in the same fashion. There was a 10min stretch break following Test 4.

Of the approximately 55 people in attendance, 40 submitted voting sheets. In addition to voting on listening tests, the audience was asked to answer a short questionnaire on the same sheet. After test Seven was complete, voting sheets were collected and the audience was then shown the four different sets of cables involved in all of the tests. While votes were being tallied, capacitance measurements and frequency response measurements were conducted on each of the cables under test.

The room used for this event is in the ASM’s usual meeting venue, the Pavek Museum of Broadcasting. It is approximately 20ft wide, 38ft deep, and 10ft high, rectangular in shape with an open L-shaped area at the rear on the left channel side. It features a tight woven commercial carpet floor, an acoustic panel ceiling, and hard plaster walls. Windows along the right channel wall are covered in aluminum blinds. Speakers were positioned 8ft apart at their center and 5ft from the back wall with ribbon tweeters on the outside, toed in to converge about 12ft into the room. An equipment rack was centered between speakers. Two “cable changers” were placed behind the speakers and equipment. The first row of listeners was approximately 7ft from speakers.

The Audio Society of Minnesota/Pavek Museum house system consists of a modified/upgraded Oppo BDP-83 multi format player with analog stereo output into an ARC SP-17 preamplifier feeding two ARC M-300 mono power amplifiers.

Full Disclosure

As guided by “Murphy’s Law”, one of the two M-300 MkII amps blew a fuse early during test #3. Rather than attempting to determine the cause of the failure, it was decided to switch to a back-up amplifier, an ARC D-115MkII. This created a 15 minute downtime period followed by several quick attempts to adjust levels and balance to match that of prior tests. The second half of test #3 and all remaining tests were done using this second amplifier.

There were several comments to the effect that the sonics of the second amplifier, which was slightly preferred. Hopefully this did not significantly influence the results of test #3 and remaining tests.

Interconnects were Anti-Cables while the speakers were Magnepan 3.6. Connections on both speakers and amps are stock screw down block terminals. Because of this, we preferred to use cables of spade terminations for easiest installation and changing without the use of any adaptors on terminations. Cables were kept hidden from view at all times.

The Results

So what did we find? Do cables make a difference and are expensive cables better than cheap ones? Looking at the proportion of votes for the cable pairs does indicate that some cables were preferred over others.

(At this point, all 4 cables have been tested against one another – each being involved in three tests.)

Test #7: A & C:
C: 49%
A: 41%
No Preference: 11%

As noted earlier, test #7 is a repeat of test #4, except order of cables is reversed. It is interesting to note that even though cable order was reversed, results came out nearly the same.

Here’s another way of looking at the results:
Cable C: 3 wins, 0 losses
Cable D: 2 wins, 1 loss
Cable B: 1 win, 2 losses
Cable A: 0 wins, 3 losses

The win loss records represent a clear ranking in that no cable defeated a cable ranked higher than itself.

Of all Votes that noted a cable preference (all first 6 tests combined) results are:

This shows that listener votes of “preferred cable” align more with Mids and Highs preference than with Bass response preference.

Questionnaire Results:

55% of voting audience uses bulk wire (not branded) on their home systems. Of those that use branded cables, 72% cost $500 or less per set in retail dollars. Therefore, 13% of audience use “expensive cables”, 33% use branded cables $500 or less.

Before this test 69% of our test subjects thought that speaker cables could make a significant difference. After this test, 86% believe that speaker cables can make significant differences.

Since no statistical tests of significance have been applied to the results it is not possible to demonstrate that one set of cables was found to be superior to any others in an objective sense. Subjectively, however, it was shown that cable C received more preference votes than the others with cable D, the prototype silver/Teflon, running in second place. Cable B fell more or less in the middle of the rankings. Cable A, the zipcord, was not preferred on any of the three comparison tests in which it was included, suggesting that, yes, these cheap and commonly used cables do not sound as good as cables designed for the audiophile market.

Based on the results of this informal but honest attempt to address the questions posed earlier, it does appear that in this case at least, there was a preference for the expensive cables and a definite non-preference for the cheap zipcord. So cables do make a difference.

Next stop…interconnects!

Observations

Points of Interest regarding Voting:
- As a group, those who use bulk wire as cabling liked the bulk wire (A) the least.
- As a group, those who owned expensive (not bulk) cabling favored the cheap bulk wire (A) over the most expensive cable (B).
- As a group, those who owned brand named cabling (not bulk) were less likely to cast a "non-preferred" vote.
- As a group, those who sat in a more ideal room location were more likely to vote alike. For this grouping in test #3, cable (B) received zero preferred votes. For this same grouping in test #4, cable (A) received zero votes.
- Cables listened to as #2 and #4 in order of each test, received slightly more preferred votes. Yet, the most popular cable (C) was first/third in order in two of three tests.

All listener comments (in regards to cables) that were written onto the voting sheets:
- One listener wrote that their favorite two cables were #2 from test #2, and #2 from test #3. This was cable D in each case.
- One listener wrote that their favorite cable was #2 from test #7, and second choice was #1 from test #2. This was cable C in each case.
- One listener wrote that the worst cable was #1 (A) from test #7, where the least popular cable was compared to the most popular cable.
- One listener wrote asking if cable #1 from test #6 (D) was the same as cable #2 from test #7 (C), the two most popular cables. No other listeners made guesses or comments regarding which cables were their most or least favorite.

Does this imply that those who cared to comment, had golden ears?

Points of Interest Regarding the Questionnaire:
- Seven listeners initially indicated that speaker cables do not make a significant difference, then changed their decision after the test.
- One listener initially indicated that speaker cables do make a significant difference, then changed that decision after the test.
- The term “significant difference” was left open for interpretation.

Measurements

This graph shows the transfer function magnitude (frequency response) of each cable. Order of the cables from top to bottom is B, C, A, then D.

The measurements represent the transfer function of the cables only. The reference probe was attached to the amplifier output and the measure probe was attached at the speaker input. The cables were measured with an MLS signal using Speaker Workshop with a Roland UA-1EX sound interface at a 48kHz sample rate. A signal length was chosen to give ~1.5Hz resolution. Some of the measurements had artifacts at 60 or 120Hz, these were removed for this graph, and the measurements were 1/6 octave smoothed.

The Impedance of the Magnepan 3.6R was measured and found to be largely resistive with a value ~4.6-4.7 ohms except for a large peak of about 85 ohms centered at approximately 560Hz.

Credits

Don Meger was the principal writer of the articles and test procedures. Gene Lyle assisted with the editing and final drafts of the articles. Ron Ennenga did the frequency response measurements and graphs on the cables. Frank Van Alstine provides the capacitance measurements.

COMMENTS
fufanuer's picture

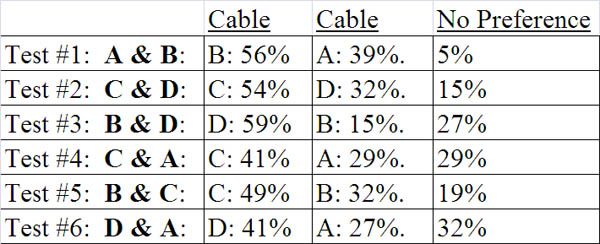
"There were several comments to the effect that the sonics of the second amplifier, which was slightly preferred. Hopefully this did not significantly influence the results of test #3 and remaining tests." - How can this be a scientifical experiement or worth discussing when they change a variable (a new amp half way through)? They should have thrown out the first tests and started all over.

popluhv's picture

I'm glad people are doing this sort of stuff, independently. 


PS, which is which of the graph above?

Bixby's picture

Wish they had tested something between the zipcord and the rest of them, which are all in the exotic price range to me. Seems like the most interesting thing that could come out of something like this is not, does the $8000 cable score better than the $3 cable, but where does the $100 cable (or even $300 or...) score? It's about finding that maximum return before the law of diminishing returns.

drkmods's picture

Yes, sonics may have changed due to a different amplifier employed, but voting was consistent across all tests.  There is no indication that any particular cable was favored or disfavored more or less because a different amp was employed half way through testing.   

True scientific testing would of course require more rigorous and tedious protocol.  Getting 50 people in one room to sit still through almost 2 hours of repeated listening is an accomplishment in itself.   

I find the listener comments most interesting.  A few listeners showed that they had truely golden ears, or extreme luck.       

dalethorn's picture

Doing my own statistical analysis, I see that in test #1, 44 percent either preferred the $3 cable or didn't have a preference for the $8k cable. That's only 7 points out of a hundred below a majority. Compared to cable C and D, each over $1000, 58 percent and 59 percent preferred the $3 cable or had no preference for C or D. That's an even greater majority than the 44 percent minority.

The $3 cable beat(!) the $8k cable in bass, lost 3 to 4 in mids (3/4 is pretty close in audio/hi-fi), tied(!) in treble, and lost 10 to 11 overall. 10 to 11? Three dollars to 8 thousand dollars?

Now assuming a large percentage of the guys who come out to these meetings and events just aren't good judges of sound quality, it makes me wonder about the judgements of some of the most vocal members of current hi-fi forums. Maybe some of these guys just came for the coffee and desserts? I dunno.

EVOnix's picture

each cable should have been tested against itself.

Without that data, there's no way to assess how much was due to random chance. Forgive me if I'm not using the right terms, I'm not a statistician, but if the data for same cable tests showed the same percentage spreads as the actual X vs Y tests, then the whole thing is statistically invalid. If they showed no spread, iow 50:50 for all same cable tests, then we can assume the panel correctly heard the "no difference" test, which would lend credence to an X vs Y test in which one cable was much preferred.

And they should have started the test over with the second amp.

dalethorn's picture

Good point about testing each cable against itself.

Archimago's picture

Excellent work dalethorn.

Statistical analysis is essential for something like this.

Larry Ho's picture

Hi, by the statement of following....

"Here’s another way of looking at the results: 

Cable C: 3 wins, 0 losses 
Cable D: 2 wins, 1 loss 
Cable B: 1 win, 2 losses 
Cable A: 0 wins, 3 losses

The win loss records represent a clear ranking in that no cable defeated a cable ranked higher than itself."

I guess the cable B should be $800, not $8000?

drkmods's picture

Cable B was in fact at $8000 retail.  In the article, "ranking" refers to # of wins, not a ranking by price.

Keep in mind that this was not a test to prove or disprove anything.  It was what we at the club thought would be an interesting and hopefully enlightening experience.  We attempted to perform listening tests within reason that would satisfy a basic curiosity: Are there sonic differences between speaker cables?"  

I think that our results show that there are perceived differences, and yes, maybe perception becomes reality.  There is no testing procedure that I am aware of that could possibly determine a superior cable, but only which cable is preferred within a particular set of circumstances.    

We used 16 gauge zipcord as one of the cables since there are numerous mentions in literature (from an engineering perspective) regarding 16 gauge speaker cable as being all that is needed to faithfully carry a signal within reasonable length.  The other cables were supplied by a local firm.  We weren't concerned with what was supplied, as long as they were "branded" cables of significant price over that of bulk wire and that they could be connected without use of adaptors. 

Interesting and debatable points can be made regarding the scientific quality of the test procedures and the statistical validity of the results, but that does not deter from the implication of our findings that speaker cables can make perceived sonic differences.  I refer back to the comments submitted on the voting sheets.  The few that wrote comments were exceptionally clued in to identifying sound quality of specific cables across numerous tests.  Those comments certainly imply that more was taking place than random chance.     

Feel free to use the link provided for the Audio Society of Minnesota Website.  There is more detail provided there regarding voting preferences and breakdowns by subgroupings.  

We are tentatively planning a similar testing event for interconnects next season.  Some of the comments made here will help us with our event planning.  

I would be very interested to read results of similar tests done within the rigorous requirements demanded by some of the readers.   I'd also be happy to participate and supply the coffee and desserts.   


HiRezNut's picture

I'd be happy to assist with analyzing this data or that from your upcoming interconnects test, if you like, as this is what I do for a living.  E.g., here's one relatively simple way to possibly improve the power to detect differences with data like that I believe you already collected.  

1. Reduce the data for Tests 1-7 for each listener to form a single listener-specific score for each cable, and apply standard statistical inference to the reduced data.  E.g. to test whether cable A was differentially preferred, let Ai denote the number of tests in which Listener i stated a preference for cable A, where i runs from 1 to n (the total number of listeners).  Let NAi denote the number of tests involving cable A for which Listener i stated a preference for another cable over cable A.  Let DAi = Ai - NAi (i.e. wins - losses) be Listener i's score for cable A.  If Listener i always preferred cable A, and if he recorded data for all 7 tests, then DAi = 4; if he stated "No Preference" for all of the tests (for which he recorded data), DAi = 0; if he always preferred cable B, C, or D to cable A, then DAi = -4. 

2. Compute the sample mean and standard deviation (SD) of DAi over the n subjects.  Also compute the standard error (SE) of the mean: SE = SD/sqrt(n) is a measure of uncertainty or precision of the estimated mean.  

3. To formally test whether Cable A was differentially preferred (while combining all available data from Tests 1-7 into a single statistical test), let tA = mean(DAi)/SE(DAi) represent the t-statistic with n-1 degrees of freedom (df).  If n = 41, then If |tA| > 2.0211, then 2-sided p<0.05, and conclude that cable A was differentially preferred (in one direction or the other), while if tA < -1.6839, then 1-sided p<0.05 and conclude that cable A was considered inferior overall (but the direction of any 1-sided test must be dictated by the cost or a priori expectation of the cables and not by the data).  If p>0.05, then it is not generally appropriate to conclude that there is no difference between the cables, as the study might have been underpowered (too few listeners, e.g.) to detect a modest effect size; instead, the appropriate conclusion would be that there is insufficient evidence of a difference. 

4. A 95% confidence interval (CI) for the mean can be constructed as follows, if desired:  mean +/- 2.0211*SE.  Alternatively, or in addition, the SE of the mean (or sometimes just the SD) is often reported; e.g. mean (SE) = 0.5 (0.2). 

5. Similar methods could be applied for cables B, C, and D.  One novel ad hoc way to test for trend using all of the data to generate a single p-value would be to compute subject-specific sample correlations ri between (DAi, DBi, DCi, and DDi) and the costs (3, 8000, 1200, 1000), the cost ranks (1, 4, 3, 2), or the approximate cost ranks (1, 4, 2.5, 2.5).  Then if tr = mean(ri)/SE(ri) > 1.6839, then 1-sided p<0.05, and conclude that cost is positively correlated with performance.

Jimmy41's picture

I for one appreciate your comments! I work with statistics (power plant controls optimization using neural networks etc...) enough to respect the way they defeat intuition so easiliy... though as a B student I would have appreciated the results of your analysis design... :-) since I am looking for audio Shangri-La - and don't know what to think about cables. 

QSYSOPR's picture

If you plan to test the interconnects the same way you did with the cables it will lack any scientific care - period.

All results based on the test conditions described are irrelevant since they are all within the statistical uncertainty only.

The "win-loss-summary" is more than doubtful.

If this was really a blind test, then it was a single blind test. No scientist would rely on study like this. Double blind - or even better tripple blind studies have to be made to get substantial relevance. 

If you are interested in how auditory memory grows with the number of hearing the same material look here: 

http://www.sciencedirect.com/science/article/pii/S0896627310002850

Thank You for your patience.

JasonVSerinus's picture

I am always amused by tests, supposedly conducted under rigorous conditions, that purport to "prove" what many of us hear regardless of the "proof." It is as though statistical analysis could possibly replace one's visceral and emotional reactions to music.

Be that as it may, one point about cables. Depending upon their geometry and insulation, they need time to settle in after being moved. As Keith Johnson once explained to me, in the case of Teflon, when you move it around, microscopic fissures appear that need a day or so to smooth over and no longer affect the sound. (Apologies to Keith if I've used incorrect terminology here; I believe I've conveyed the essence of his message.)

Hence, in your next test, it would be ideal to lay all the cables out a day beforehand, as close as possible to the sources where they will be used, so they can be in optimal condition, and to take care to connect and remove them with minimum bending and twisting, so that they are moved minimally as you switch them. This is extremely difficult in the case of interconnects, I realize. But it will certainly make for greater accuracy in your listening tests.

As to how well the brain can respond to all these rapid shifts and repeats of the same musical selection, which to my way way of understanding and listening reduces music to a set of ordered aural indicators, that too we shall leave to discussions that have gone on since the first person blindly declared, with the same absolute assurance that asserts that evolution does not exist, that blind and double blind and totally blind testing are the only way to see what is really happening on the audio front. But, then again, I don't have any opinions of my own on the subject. At least none that can be verified by double blind testing.

EVOnix's picture

Sorry, but without same cable tests the results are completely meaningless.


Any scientific test will have a control, that's why drug tests always contain a placebo, to provide a baseline knowledge when it is known there is nothing under test. If the same cable tests indicated that people consistently preferred one cable to another, then something is wrong with the test, or there exists a standard deviation of error such that any results within that error are invalid.


That people commented on perceived differences between cables is proof of nothing.

jackgreen's picture

There is also one simple way to interpret this data from the standpoint of cheapest cable.

1. In test 6, 27% said that A was better cable and 32 told that A is as good as D. This means that 59% of listeners said that A was equal or better than D

2. in test 4 29% said that A was better cable than C and additional 29% told that A is as good as C. This means that 58% of listeners said that A was equal or better than C.

My point is that if zipcord is better or equal in 60% cases, there is huge price difference is not adjusted.

Swapping the amp wasnt the best ideaa, but lets not forget that cables competed agains each other. And cable has to sound with each amp. So, this factor is not important for me.


music guy's picture

Just wondering why they didn't list the name and model of the cables used.  The description of Cable B suggests it's made by Nordost but the others are too generic in description to tell.

WW

rboehl's picture

I agree that the cables should have tested against themselves.
I have have given some of these tests over the years as well as been a participant. They can be very humbling. As far as moving the cables goes ,if you can hear that then more power to you. The Amp was changed part way thru and that will change some results because the cables can interact differently with different amplifier outputs. The cable I would have also used was a larger gauge Zipcord, i.e. 10 gauge, since all the other cables seems to be of a larger gauge. I think that over the years as my ears lose the high frequencies that I could readily hear in my youth I might not be able to discern much difference anymore between the cables.
I dare say that the ages of various participates needs to be taken into account because of that.

HiRezNut's picture

First of all, I think the Audio Society of Minnesota (ASM) ought to be heartily congratulated on taking the time and effort to collect this interesting blinded data comparing speaker cables.  Thanks, guys!  I was mainly disappointed that insufficient thought went into how the data might be analyzed, but I suppose that's because that's a big part of my job as Associate Professor of Biostatistics and Computational Biology at The University of Rochester Medical Center.  Some of the criticisms here largely miss the mark, in my opinion, as I would never have planned to spend these folks' time comparing cable A to A, B to B, C to C, and D to D --although this would have provided information on rater reliability.  I mostly like ASM's choice to perform all 6 possible pairwise head-to-head comparisons, and they even threw in a replicate of the A vs. C comparo, which provides some additional information on the potential order effect.  Reading ASM's pdf summary, I noted that several raters actually left after the 1st 3 head-to-heads as it was, so asking for many more tests (including swapping the order of the other 5 pairwise comparisons and/or comparing each cable to itself) might be prohibitive.  Anyway, the bad news for me (as I have convinced myself that cables, interconnects anyway, matter) is that this data provides insufficient evidence to conclude any differences.  I can provide more details if anyone cares (including those below), but the only head-to-head comparison that might be considered statistically significant is Test #3, where $1K cable D appeared to trounce $8K cable B by 4:1 (2-sided nominal p = 0.0014, and p = 0.01 even with Bonferroni adjustment for 7 comparisons, if anyone is familiar with p-values, where p<0.05 is typically considered "significant").  HOWEVER, this was the test during which the amp was switched!  Thus, cable D's dominance in Test #3 can probably be attributed to the listener's clearly stated preference for the 2nd amp.  It was a somewhat serious and unfortunate oversight not to restart Test #3 with the new amp, if that's indeed what happened.  The fact that the amp was different for the remainder of the tests (4-7) has essentially no bearing on each of those individual tests, though it might complicate attempts to combine information from Tests 1-2 with that of Tests 4-7.  Speaking of combining information over all tests, I had hoped this might bolster the power to show cheap cable A to be inferior, but it was not enough.  Using Fisher's method to combine independent p-values still resulted in p > 0.1, and adjusting for the positive dependence between the tests would only further increase the p-value.  Alternatively, aggregating the data to 0 wins and 3-4 losses (depending on whether you want to count Test #7) would at best provide 1-sided p = 0.0625-0.1250 and 2-sided p = 0.125-0.250; i.e. there is at least a 1 in 8 chance of observing 0 wins and 4 losses, or 4 wins and 0 losses, even if all cables were identical --1 in 16 chance for 0 wins and 4 losses, a priori assuming A should be worst, which is at least borderline significant.  Finally, excluding problematic Test #3 and combining the 6 other 1-sided exact p-values via Fisher (assuming the pricier cable should outperform the cheaper cable in each test) yields a lower bound on the overall p > 0.15 (still not significant), implying that there is greater than a 1 in 7 chance of observing data like this (or more extreme) even if all 4 cables were identical.  Bottom line:  no significant differences.

Jimmy41's picture

Thanks for your analysis, and I believe you are right. My take away from the discussion is that the variance in the "implications of inference" is... a bit high for comfort. Though I would love to see more testing. Plus the amp thing does seem like a big deal...

I'd be interested to know if the human element could be removed as a first step, to be replaced by an open set of metrics that could be used to detect repeatable difference in the delivery of energy and information. If something like a mechanized dog-bat's ear cannot detect meaningful change - it's noticeably harder to propose that human beings can hear "improvment". If such an array of measurment can at least establish there are physical differences at the system output that can be detected (not parameters of construstion that differ), then the second question has a hypothetical leg to stand on at least. I' don't know maybe this has been done somewhere? I guess the results of the dog-bat ear would have to be ovelayed with the expected performance of the mean and max human ear. 

Scorpio69er's picture

Since we are talking about differences in what people think they hear when it comes to expensive vs. cheap cables, it seems to me that we must first have an accurate understanding of the actual hearing abilities of each human subject. All subjects would need to have their hearing checked and these results would need to be taken into account. There is no point in making sure the electronics, etc., under test are properly calibrated and that all possible areas of variation are minimized, then ignore the wide variation in hearing ability that inevitably exists in the audience. Who knows, we may find that those with perfect hearing prefer cheap lamp zip cord.

If anyone can ever demonstrate scientifically that audible differences actually exist between cheap cables and ridiculously priced ones (and that such audible differences also produce a demonstrably higher quality sound), I'll think about forking over some extra dough. But the fact is no one has ever done this. Indeed, going back to tests I read about many years ago conducted by A.J. van den Hul*, where he tricked his audiophile audience into thinking he was using an esoteric speaker cable when in fact it was lamp zip cord -- drawing nods of approval from his punked audience who heard all kinds of wonderfulness -- every test of this type I have ever read about shows there is no audible difference. 

*It should be noted that A.J. van den Hul subsequently moved into the esoteric cable business. These guys know their way to the bank.

Ariel Bitran's picture

if you were following the comments on JA's Heyser lecture (also on this website), i think one of the biggest problems that audiophiles/scientists will run into when trying to do cable comparison tests (and any sort of listening comparison test) is sample selection and variability within the (most likely) convenience sample.

if listeners are not trained, their answers should be considered something closer to random guessing... is this something that would infer that there is a difference or a lack of one?

a trained ear will perform better at these tests, which brings up the question, does it matter? if a trained ear is required, maybe the difference is more inside our minds than we think?

Scorpio69er's picture

Thanks for taking the time to read my blurb.

re: "a trained ear will perform better at these tests"

That has never been scientifically established. It would be interesting to put Stereophile's reviewers to the test, assuming such a test was constructed to take into account all of the possible variations outlined by everyone here.

Insofar as "maybe the difference is more inside our minds than we think", until someone actually proves otherwise, this has to be accepted as the fact of the matter. Audiophiles want to believe in magic, and those who profit from selling us the latest mega-expensive piece of wire take full advantage. Looking at how various esoteric pieces of wire are advertised and marketed is an education in the art of selling. As George Carlin famously said, “If you can nail together two things that have never been nailed together before, some dumb schmuck will buy it from you”.

I am often amused when I look at the glossy ads for various esoteric pieces of wire that tout all sorts of magical musical benefits from the product, as if the electrons moving through them know the difference. This is especially true now that we have moved to digital transmission of musical information, as if the ones and zeroes give a hoot about how they reach their target. Digital is either on or off. If the information is not transmitted for some reason, there is simply silence. 

P.S. This piece is interesting, although the tests are not as rigorous as would be needed to be scientifically conclusive:

http://www.nousaine.com/pdfs/Wired%20Wisdom.pdf

QSYSOPR's picture

Every time I read about "trained ears" i wonder. 

If only trained ears can hear the differences, why all the hype in selling ridiculous costly cables to to average customer? 

Question: do I have to have trained eyes to see the difference between a standard HDMI 1.4 cable and an esoteric one?

I'm worried about all the pseudo-scientific phrases used in selling expensive cables. Thats for instance when a cable manufacturer speaks about "routed air strings” and separate “quantum tunneled” Mini Power Couplers - I don't know whether I should laugh or cry.

If it is a question of taste then I will not worry about people throwing their money on the streets, otherwise ....

Ariel Bitran's picture

the point that is to be made is that anyone can train their eye/ear (barring actual physical limitations/extreme hearing loss/eye sight problems).

Scorpio69er's picture

Using only the highest grade ore mined from our private copper, gold and silver mine in Chile's Atacama Desert, then refining that ore in a proprietary process handed down through four generations and sheathing nature's purest metals in theta-rejecting baby llama skin, we have fashioned the ultimate in speaker cables and interconnects: The Scorpio Line.

Death Stalker: At only $2000/meter, this special 1000:1 blend of our purest copper and silver will yield the highest possible SPL when listening to heavy metal music, while maintaining a warm yet neutral character with your favorite bagpipe piece. The sonic equivalent of Angus Young in a kilt.


Black Spitting Thicktail: This 1111:11:1 blend of our purest copper, silver and gold has been hailed by reviewers as "a revelation". At $10000/meter, it will transport you to another sonic realm. Whether listening to powerful symphonic music or the soothing strains of Slim Whitman, your hair will turn white as you encounter the mystical. As they say, "you can't take it with you", so why worry about the cost?


Asian Forest: Specially designed to reproduce the whole range of natural sounds from an ant fight to an exploding supernova with equal realism, this 1313:13:3 blend of our purest copper, silver and gold throws a soundstage as big as all creation. At $50000/meter, like Yahweh himself, you can have the whole world in your hands. Just remember to put it back when you're finished.


wink

Ariel Bitran's picture

you should buy ad space in Stereophile for it.

Scorpio69er's picture

Thanks again for taking the time to read my blurb. I wonder how many orders I would get? I could generate "buzz" by circulating around the next trade show with a few friends and having us make comments in the crowd at every manufacturer's venue like, "Gee, this would sound so much better if they would have used some of that Black Spitting Thicktail™ for the interconnects and Asian Forest™ for the speaker cable!" Audiophiles would be intrigued and begin asking, "Where can I get some?" The rest will be history.

Actually, Stereophile should pay me for writing this stuff. cheeky

dwpatterson's picture

Considering how little the 16 gauge wire set lost by, a more honest and competitive choice should have been 12 or 10 AWG speaker wire. Still inexpensive but have a higher performance lower resistance.

X