| Columns Retired Columns & Blogs |
Zesto Audio Leto line preamplifier Measurements
Sidebar 3: Measurements
I used Stereophile's loan sample of the top-of-the-line Audio Precision SYS2722 system (see www.ap.com and the January 2008 "As We See It") to measure the Zesto Leto. I carefully installed the four tubes—two 12AU7s, two 12AX7s—in the correct sockets, as instructed in the manual. With the Leto's volume control set to the maximum, the gain for balanced input and balanced output was 13.55dB in the left channel, 14dB in the right. For unbalanced input to unbalanced output, the gains were 12.1dB left and 12.52dB right. The Leto preserved absolute polarity (ie, was non-inverting) in both balanced and unbalanced modes, the XLRs being wired with pin 2 hot.
The Leto's balanced input impedance was 12k ohms from 20Hz to 20kHz, slightly higher than the specified 10k ohms. The unbalanced input impedance, however, was much lower than the specified 100k ohms, at 11k ohms. The output impedance was the same from both sets of outputs: 104 ohms at low and middle frequencies, rising to 160 ohms at the top of the audioband.
Fig.1 shows the Leto's frequency response in single-ended mode, measured into 100k ohms (blue and red traces) and 600 ohms (cyan, magenta), with the volume control set to its maximum. The audioband response is flat into the higher impedance, but there is a sharply defined peak at 103kHz. This peak is replaced by an ultrasonic rolloff into the very low impedance. Note the channel imbalance in these traces, which favors the right channel by 0.45dB. (For these measurements, I set the balance control to its central, detented position.) Neither the height of the peak nor the channel imbalance in fig.1 was affected by the position of the volume control. There is no ultrasonic peak in balanced mode into the two impedances (fig.2), and the output rolls off smoothly above the audioband.
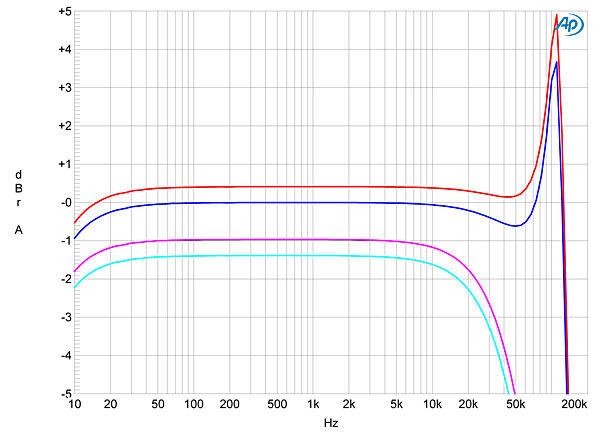
Fig.1 Zesto Leto, unbalanced frequency response with volume control set to maximum at 1V, into: 100k ohms (left channel blue, right red), 600 ohms (left cyan, magenta right) (1dB/vertical div.).
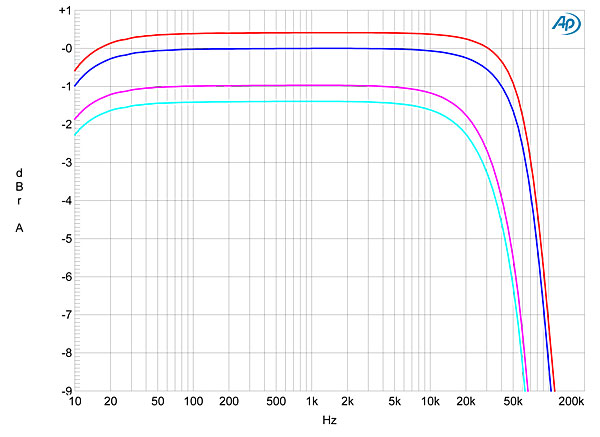
Fig.2 Zesto Leto, balanced frequency response with volume control set to maximum at 1V, into: 100k ohms (left channel blue, right red), 600 ohms (left cyan, magenta right) (1dB/vertical div.).
Channel separation (not shown) was better than the specified 90dB below 2kHz in both directions, but decreased to 70dB at the top of the audioband. The Leto was sensitive to how the ground between it and the Audio Precision was arranged. I obtained the lowest level of random noise with the SYS2722's signal generator grounded and the ground-lift switches on the Leto's rear panel set to Off. In this condition, the wideband, unweighted signal/noise ratio, measured with the input shorted to ground and ref. 1V into 100k ohms, was a good 85.4dB left and 88.7dB right. Restricting the measurement bandwidth to the audioband didn't changes these figures, though switching into circuit an A-weighting filter improved them to 100.5dB left and 103.2dB right.
Fig.3 shows the spectrum of the Zesto preamp's low-frequency noise floor in balanced mode. Though the level of random noise is low, a series of spuriae at 60Hz and its harmonics can be seen. The odd-order harmonics are most likely due to magnetic interference from the power transformer, the even-order harmonics from electrical interference from the full-wave–rectified power supply. However, all are very low in level, lying at –96dB (0.0015%) or below. Examined at the unbalanced output, the 60Hz and odd-order harmonics were all lower than in balanced mode, suggesting that at least some of the magnetic interference is being picked up by the input and/or output transformers.
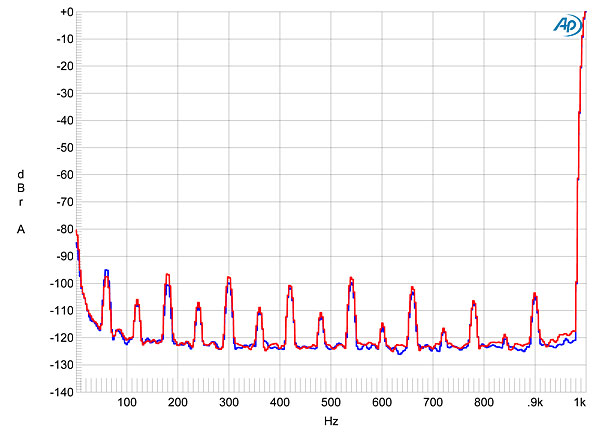
Fig.3 Zesto Leto, balanced spectrum of 1kHz sinewave, DC–1kHz, at 1V into 100k ohms (left channel blue, right red; linear frequency scale).
The Leto reached its maximum specified output of 10V at 2.5% THD in balanced mode into 100k ohms (fig.4), and at 2.8% THD in unbalanced mode into the same impedance (fig.5). We usually specify clipping as when the THD reaches 1%, which in the Leto's case gave maximum outputs of 6.5V balanced and 5.3V unbalanced. Commendably, these voltages were hardly affected when the load impedance was dropped to 600 ohms. The shortfall in maximum output is moot, however, as all these voltages are well above those required to drive any power amplifier into clipping. What is more interesting is the shape of the traces in these two graphs. The percentage of THD+noise reaches a low minimum value of 0.037% balanced and 0.065% unbalanced, at an output of around 250mV. The slow but linear increase in THD above that level suggests that the Leto's circuit uses a minimal amount of negative feedback. At a level of 1V, which was high enough for me to be sure I was measuring actual distortion rather than noise, the THD percentage hardly changes with frequency or load impedance (fig.6). The only exception was below 40Hz, where there was a very slight rise, presumably due to the beginning of core saturation in the output transformer. (Fig.6 was taken in balanced mode; the unbalanced mode was identical, other than not having the small rise in THD below 40Hz.)
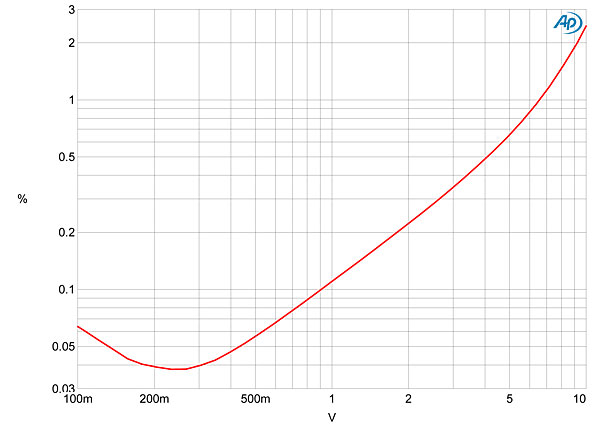
Fig.4 Zesto Leto, balanced distortion (%) vs 1kHz output voltage into 100k ohms.
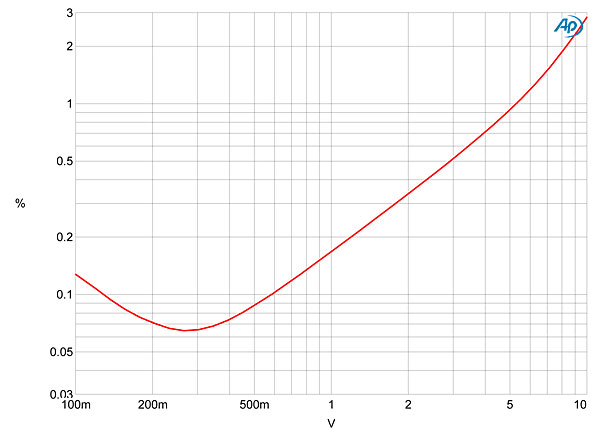
Fig.5 Zesto Leto, unbalanced distortion (%) vs 1kHz output voltage into 100k ohms.
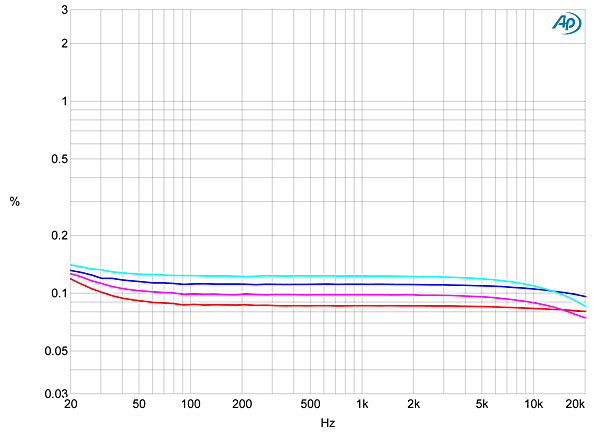
Fig.6 Zesto Leto, balanced THD+N (%) vs frequency at 1V into: 100k ohms (left channel blue, right red), 600 ohms (left cyan, right magenta).
More important, the character of the Leto's distortion signature was heavily second-harmonic (fig.7), with the third harmonic almost 15dB lower in level. Though some higher-order harmonics are visible in this graph, they all lie at or below –100dB. This graph was taken in balanced mode; in single-ended mode, the second harmonic remained at the same level, but the third harmonic dropped by another 5dB or so. In either mode, the spectrum didn't change when I reduced the load impedance to 600 ohms or increased the signal frequency. With the demanding high-frequency intermodulation test, the second-order difference product at 1kHz lay at –52dB (0.28%) in balanced mode (fig.8), and –54dB (0.25%) in unbalanced mode (not shown). But in both modes and with 600 ohm loading, the difference products didn't increase in level, and the higher-order products at 18 and 21kHz remained below –70dB (0.03%).
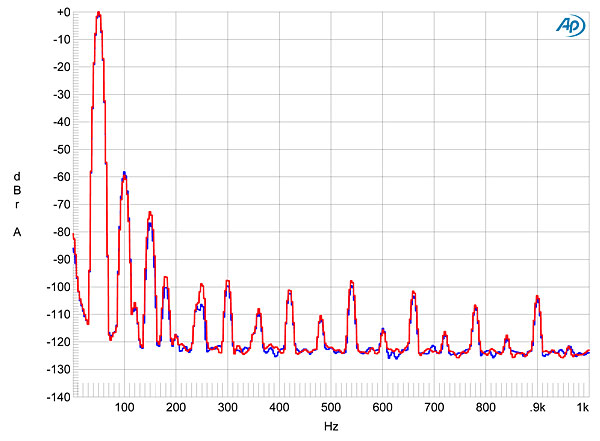
Fig.7 Zesto Leto, balanced spectrum of 50Hz sinewave, DC–1kHz, at 1V into 100k ohms (left channel blue, right red; linear frequency scale).
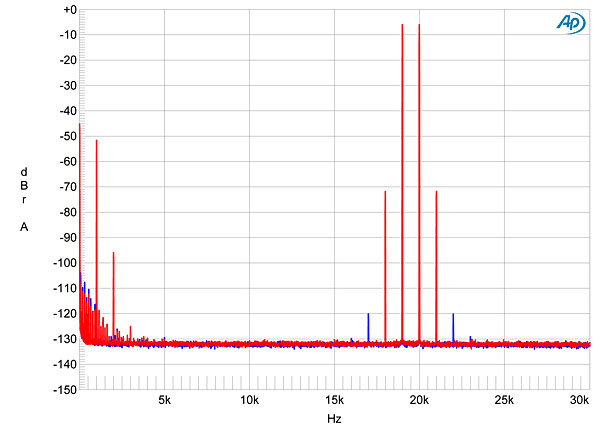
Fig.8 Zesto Leto, balanced HF intermodulation spectrum, DC–30kHz, 19+20kHz at 1V peak into 100k ohms (left channel blue, right red; linear frequency scale).
I was impressed by how Zesto's Leto measured. Yes, its distortion at levels above 1V is higher than you would get with a solid-state design. But that distortion is predominantly the subjectively innocuous (and, some might say, the subjectively preferred) second harmonic; more important, the Leto's distortion signature doesn't change with level, frequency, load impedance, or at different volume-control settings. This stable behavior is rare, but is something I have conjectured correlates with good sound quality. I am not sure, therefore, why BJR found that the Leto "seemed to run out of gas a bit" with highly modulated musical passages. The rise in THD seen in figs. 4 and 5 only rises to a level that will be audible well above the voltage required to drive Bob's amplifiers into clipping, so perhaps he was referring to the intermodulation behavior, which is the Leto's only measured shortfall.—John Atkinson
|
|
| ||||||||||
- Log in or register to post comments


| Loudspeakers Amplification Digital Sources | Analog Sources Accessories Featured | Music Columns Retired Columns | Show Reports | Features Latest News Community | Resources Subscriptions |
 © 2024 Stereophile
AVTech Media Americas Inc., USA
All rights reserved

