| Columns Retired Columns & Blogs |
Woodside SC26 preamplifier Measurements
Sidebar 3: Measurements
The output impedance of the Woodside SC26 at its line output measured a high 2.1k ohms at the maximum setting of the level control, decreasing a bit to 1.7k ohms at unity gain, then returning to 2k ohms at the 9 o'clock setting. The SC26 will therefore be quite sensitive to the loading effects of cables and the input impedance of the power amplifier used; both of the latter should be chosen with care—preferably low-capacitance cables and amplifier input impedances of a minimum of 20k ohms, but the higher the better.
The SC26's line-input impedance measured just over 98k ohms (L) and 119k ohms (R) with the level control at maximum, decreasing to just over 72k ohms at unity gain. The output impedance at the tape output was 773 ohms with both a 25 ohm source impedance and a 600 ohm source impedance—a clear indication of a buffered output, which will isolate the active circuitry from non-linear loads, like a switched-off tape recorder.
The measured DC offset at the SC26's line outputs varied, due to the presence of low-frequency noise, but remained below 26mV (L) and 21mV (R). Line S/N measured 81.7dB (reference 1V, unweighted, 22Hz–22kHz). Though the line stage is non-inverting from its line inputs to its main outputs, the SC26's phono stage was inverting. The maximum line-stage gain (CD input to line output into 100k ohms) measured 14.3dB.
Configured for moving-coils, the Woodside's phono-stage gain measured 56.9dB, its input impedance 257 ohms. Phono S/N measured a good 65dB (ref. 1V, unweighted). The phono input reached 1% THD+noise (with an unequalized input) at 29mV at 1kHz, 83mV at 20kHz, and 1.8mV at 20Hz. The frequency-related differences are normal, and are a function of phono-equalization characteristics (RIAA). These are excellent overload margins, considering the typical MC reference level of 0.5mV at 1kHz.
The frequency response of the Woodside SC26 is shown in fig.1. Note that the scale here has been extended to 200kHz to show the unusual behavior with volume-control changes. As the level is reduced below unity gain, a progressively increasing HF peak appears, reaching a maximum at the 9 o'clock setting of +4dB at 150kHz. The change at 20kHz, however, is small (about +0.5dB). The tracking of the level control over these settings, however, is very good—as may be seen by the tightly spaced left- and right-channel plots.
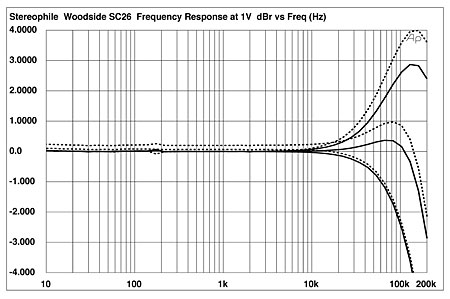
Fig.1 Woodside SC26, line-stage frequency response (from bottom to top): with volume control at 9 o'clock; unity gain; full level (right channel dashed, 2dB/vertical div.).
The Woodside SC26's interchannel separation is shown in fig.2, with the phono crosstalk on top (taken at the tape outputs) and the line crosstalk on the bottom (taken at the main outputs). Unusually, the phono crosstalk shows little change at higher frequencies (it generally increases), but a small rise in the bass. The line-stage crosstalk is more typical; both are more than adequate.
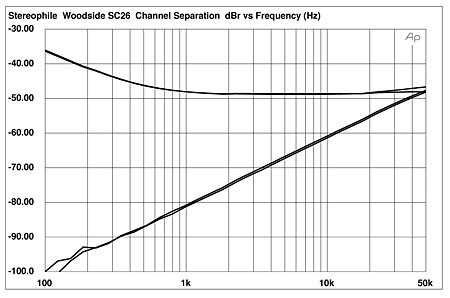
Fig.2 Woodside SC26, crosstalk: phono-stage (top); line-stage (bottom) (10dB/vertical div.).
The manner in which THD+noise varies with output voltage (at 1kHz) is shown in fig.3 (maximum level setting): the phono stage is on top, line stage on the bottom. The maximum output level from either stage (1% THD+noise) is a high 14V or so. I used these curves to select the input levels for the remainder of the measurements; the lowest points of the distortion curves were chosen, which minimizes the effect of noise on the readings. These input values were 3.5mV for the phono input and 200mV for the line input.
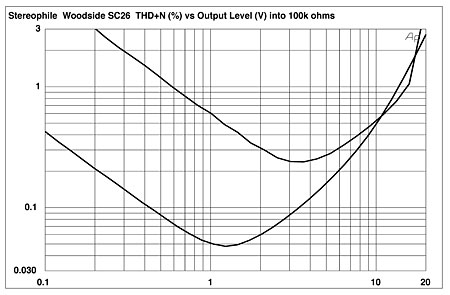
Fig.3 Woodside SC26, distortion (%) vs output voltage into 100k ohms: phono stage (top); line stage (bottom).
The THD+N vs frequency measurements are shown in fig.4. The line-stage result almost requires no comment. This is a very linear circuit. In addition, fig.5 reveals the dominant distortion harmonic to be the benign second. Note also the absence of any power-supply components in this spectrum. The phono-stage distortion level is higher, as might be expected, but is a good result for a moving-coil stage—especially considering the high, 3.5mV input level used (as explained above, this was done to minimize the effect of noise on the readings). The rise at low frequencies is presumably due to the IEC bass rolloff (see later) rather than the use of transformers.
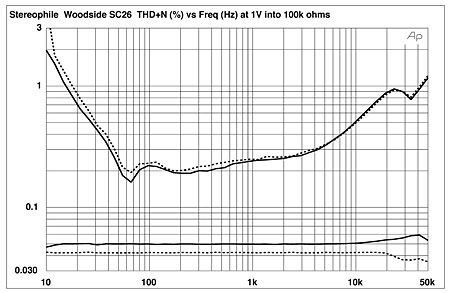
Fig.4 Woodside SC26, THD+noise (%) vs frequency: phono stage (top); line stage (bottom).
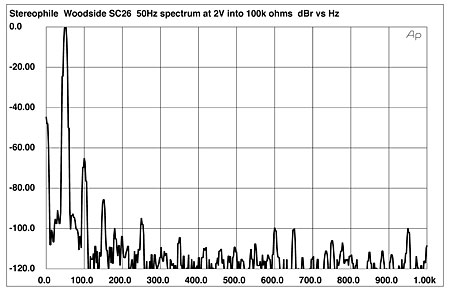
Fig.5 Woodside SC26, spectrum of 50Hz sinewave, DC–1kHz, at 2V into 100k ohms (linear frequency scale). Note that the second harmonic at 100Hz is the highest in level at –66dB (0.05%).
The frequency response of the Woodside's phono stage is shown in fig.6. Note the expanded curve. The low-frequency rolloff, obviously designed to eliminate LF resonance problems and rumble, is a little too aggressive. A response rolloff of about –4dB at 50Hz and –7dB at 30Hz will definitely be audible.
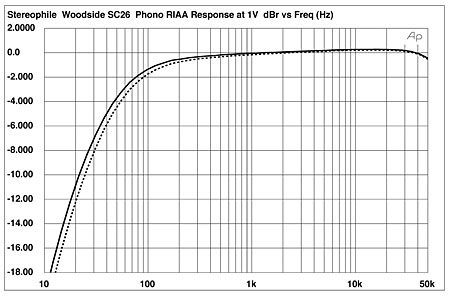
Fig.6 Woodside SC26, phono-stage RIAA error (right channel dashed, 2dB/vertical div.).
In general, the Woodside SC26 measured reasonably well, and I encountered no unusual quirks in the design. I'd like to see a lower output impedance, however, and a more extended bottom end in the phono frequency response.—Thomas J. Norton
|
|
| ||||||||||
- Log in or register to post comments


| Loudspeakers Amplification Digital Sources | Analog Sources Accessories Featured | Music Columns Retired Columns | Show Reports | Features Latest News Community | Resources Subscriptions |
 © 2024 Stereophile
AVTech Media Americas Inc., USA
All rights reserved

