| Columns Retired Columns & Blogs |
Wadia Digital 1000 Decoding Computer Measurements
Sidebar 3: Measurements
A possible cause of the mildly variable performance of the WD1000 with different systems was its high level of spurious output beyond 20kHz. For example, with a 100pF/1M-ohm loading, the output contained 20mV p–p of 20MHz content, not a happy input for some pre- or power amplifiers. Moreover, despite a premature response rolloff at the edge of the audio band, –5.11dB by 20kHz (fig.1), the level of spuriae just above 20kHz was considerable. A good illustration is given by the high-frequency intermodulation spectrum for 19/20kHz 1:1 full modulation (fig.2). On this wide-range, logarithmic frequency scale, the 1kHz difference tone appears on the first dotted vertical division at an average of –93dB—a very good result—but the beat products of 19/20kHz with the 44.1kHz prime sample rate at 22kHz and 24kHz are only suppressed by 10dB. In addition, the 88Hz-sampling second harmonic is only 34dB down. Yet another signal is evident at 52kHz, here at –43dB. Further evidence of poor ultrasonic filtering is given by the 0–100kHz spectrogram (fig.3) where, even at a low, –70dB signal modulation level, the 52kHz spurious signal remained at only 52.5dB below peak level.

Fig.1 Wadia 1000, 44.1kHz sampling, D/A frequency response at –12dBFS (right channel dashed, 1dB/vertical div.).

Fig.2 Wadia 1000, HF intermodulation spectrum, 500Hz–100.5kHz, 19+20kHz at 0dBFS into 100k ohms (log frequency scale).
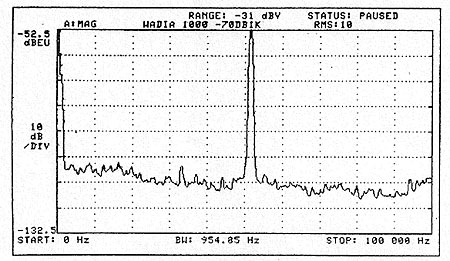
Fig.3 Wadia 1000, ultrasonic spectrum, DC–100kHz, 1kHz at –70dBFS into 100k ohms (linear frequency scale).
Channel balance was excellent—to within ±0.02dB—while very good levels of channel separation were also established, of typically 115dB midband, and still 108dB at 20kHz. Negligible phase difference was present between channels, and the output was absolute-phase correct, unless deliberately inverted via the front-panel switch. The impulse response (fig.4) can be seen to be Gaussian in character, with the reduced ripple level partly a result of tapered upper-treble response toward the sample-rate bandwidth of 22kHz allied to the Frenchcurve interpolation of sample points. The maximum output level was 2.54V, 2dB above the 2V standard, sourced from a low 220-ohm impedance.

Fig.4 Wadia 1000, impulse response (4ms time window).
A leading question concerns dynamic range and linearity; here the Wadia did not fully live up to its hi-tech promise. Very good to –80dB, below this level an "S" curve developed in the transfer function, a shade mismatched between channels. (Fig.5 shows the right channel's deviation from linearity using the dithered fade on the CBS test disc.) At –90dB input the output was typically 5dB too low, the linearity error then becoming progressively less as the level approached 110dB. The noise floor presented a barrier to further measurement. Good linearity is therefore available down to –85dB, the results then rated just satisfactory at lower levels. A 100dB effective dynamic range was established by the noise and distortion for a –70dB tone. (A factory pre-set allows for accurate –90dB calibration.)

Fig.5 Wadia 1000, right-channel fade to noise with dither, 16-bit data.
Low-level sinewave data could not be presented for this review since the ultrasonic spuriae were greater than the measured levels for representation, and no adequate filtering was available. At –70dB on dithered tones the harmonic products were respectably low for the left channel, but were poorer on the right (the spectrum for the left channel shown in fig.6). The spectrum for a –90dB tone was rather ordinary—the WD1000 was barely working here—the second harmonic registering just 8dB down on the fundamental (fig.7). Some hum components were also present, probably due to the unusual practice of locating the two supply-transformer toroids directly under the DACs. (In the WD2000, these are moved into another box!)

Fig.6 Wadia 1000, spectrum of 1kHz sinewave, DC–10kHz, at –70dBFS (linear frequency scale).

Fig.7 Wadia 1000, spectrum of 1kHz sinewave, DC–10kHz, at –90dBFS (linear frequency scale).
Fig.8 shows the analysis for the –90dB tone extended in the DC to 1kHz range, and reveals 50Hz (UK mains) supply-related components in the region of 108dB down—little enough in practice, but unusual in a high-performance decoder.

Fig.8 Wadia 1000 D/A, power-supply spuriae, spectrum of 1kHz sinewave, DC–1kHz, at –90dBFS (linear frequency scale).
At full level, the harmonic distortion measured at –87dB or 0.0045%, a little poorer than the –96dB, 0.005%, possible from true 16-bit resolution. However, a good performance was achieved at high frequencies, with a particularly good result seen at the –10dB modulation 19/20kHz mixed tone (IM products at –91 and –94dB for left and right channel, respectively).
De-emphasis was very accurate up to 10kHz, while the –0.78dB error at 16kHz was due to the encroaching treble rolloff.
The worst-case S/N ratio was 88dB no-emphasis, unweighted. Otherwise the S/N ratio results were typically 100dB or so, which was most satisfactory.
Summarizing the test results, the Wadia 1000 had some strong points but also some notable weaknesses. The transfer function was very good down to 85dB, below which slope curvature was present. Adjustment was possible, and our sample had clearly suffered drift since manufacture a few months before. Much play has been made of the advanced filtering employed in this design, and there can be no dispute regarding the high sound quality, but significant quantities of high-frequency spuriae were present above 20kHz, including complex alias beats. High peak signal levels in the 15–20kHz region resulted in high spuriae levels (8–10dB down) from 20 to 25kHz—too close and too high in level for comfort. There was no excuse for the 20MHz content in the audio signal; better internal screening is essential to control this. In these respects, the Wadia performed rather less well than a cheaper complete player. The spurious output may also be implicated in the noted variation of sound quality in different systems. An experienced dealer should be able to help advise on such matters.
The digital input circuit also needs to show better immunity to local RF interference. In this respect, the optically coupled version (an available option) should prove to be an improvement.—Martin Colloms
|
|
| ||||||||||
- Log in or register to post comments


| Loudspeakers Amplification Digital Sources | Analog Sources Accessories Featured | Music Columns Retired Columns | Show Reports | Features Latest News Community | Resources Subscriptions |
 © 2024 Stereophile
AVTech Media Americas Inc., USA
All rights reserved

