| Columns Retired Columns & Blogs |
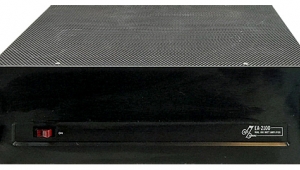
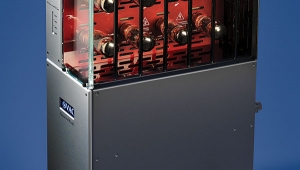
VTL 225W Deluxe monoblock power amplifier EL34 Measurements
Sidebar: Measurements with EL34s
I'll begin the measurements with the EL34'd 225s, and save any comparisons with the KT90 version for the KT90 measurements section.
The EL34'd 225's output impedance was just under an ohm across the band, measuring 0.97 ohms at 20Hz, 0.89 ohms at 1kHz, and 0.79 ohms at 20kHz. This is a moderate value for a tube amplifier, but high in relation to most solid-state amplifiers. For comparison, the VTL Compact 160 reviewed in August had a very high output impedance of about 1.5 ohms at 1kHz in triode mode and 2.2 ohms in pentode mode. The 225's high output impedance (relative to solid-state amplifiers) suggests that its tonal character will change in response to the way the loudspeaker's impedance varies with frequency. (See JA's review of the Avalon Eclipse in the January 1991 issue for a discussion of this effect.)
Input impedance was very high at 129k ohms—power amplifiers typically have 50k ohms to 75k ohms input impedance. Input sensitivity—the input voltage required to drive the amplifier to clipping (3% THD)—was a low 1.17V. The high input impedance, coupled with a high input sensitivity, suggests that the 225s will work well with passive level controls. Voltage gain was 30.5dB, about 3dB higher than typical power amplifiers. The 225 does not invert polarity, and the unweighted S/N ratio, referenced to 1W into 8 ohms, was a respectable 68dB.

Fig.1
Like the Compact 160, the 225 had fairly high distortion—especially into low impedances. Consequently, 3% THD was chosen as the clipping point rather than the more typical 1% figure. The 225's distortion could exceed 1% THD before the knee in the distortion curve that indicates the output waveform is actually clipped. This can be seen in the family of THD+noise vs power output curves of fig.1. The lower curve is the amp driving 8 ohms, the middle curve is into 4 ohms, and the upper curve is the 225's distortion when driving a 2 ohm load. This is generally good performance for a tubed amplifier: the distortion, less than 1% through most of its power range into 8 and 4 ohms, increases nearly linearly with output before clipping.
Maximum power output—defined as the 3% THD point—was 191W into 8 ohms (22.8dBW), 270W into 4 ohms (21.3dBW), and 245W into 2 ohms (17.9dBW). The decreasing output into lower loads indicates that the amplifier is current-limited—typical for a tubed amplifier. The AC line voltage was 112–113V during the clipping tests; the maximum power output may be higher with an AC line held rigidly to 120V.

Fig.2
The THD+noise vs frequency curves are shown in fig.2. They represent, from bottom to top, 1W output into 8 ohms, 2W output into 4 ohms, and 4W output into 2 ohms. These power outputs represent a constant 2.83V across the load. The distortion levels are fairly low for a tubed amplifier, but when driving 2 ohms at high frequencies, the distortion becomes significant—1% at 20kHz—although the harmonic products will be beyond the audible range. Overall, however, the 225 is well-behaved; when driving 8 ohms, the distortion was less than 0.04% up to 10kHz. Even the 4 ohm curve stayed in the 0.06% range until the lower treble.

Fig.3
Looking at an amplifier's distortion products with the fundamental removed is interesting. The lower trace in fig.3 shows the 225's distortion products when reproducing a 1kHz sinewave at a power output of 2W into 4 ohms (the upper trace is the test signal). The distortion is primarily innocuous third-harmonic, overlaid with noise and some higher products. (Count the number of cycles in the distortion product during one cycle of the fundamental above it.)

Fig.4
Frequency response, for the record, is shown in fig.4 and yields no surprises. The lower curve is at 2W into 4 ohms, the upper curve at 1W into 8 ohms. There is a very slightly greater HF tilt to the 4 ohm curve: the treble tends to rise in the top octave, while the bass dips slightly below 70Hz. This difference is negligible—0.3dB variation between 20Hz and 20kHz.

Fig.5
Looking at the 225's low-level reproduction of a 10kHz squarewave in fig.5, we can see a significant amount of overshoot on the squarewave's leading and trailing edges, as well as some damped ringing at an ultrasonic frequency.

Fig.6
Fig.6 is a spectrum analysis of the 225's output when reproducing a 50Hz sinewave at 72W into 4 ohms. The 50Hz fundamental can be seen at the left vertical cursor, with the attendant harmonic products at 100Hz, 150Hz, and so on. The predominant harmonic product is at 150Hz—the third harmonic—at –42.3dB with respect to the fundamental, just under 1%, confirming the analysis in fig.3. Note the absence of upper-order distortion components—the EL34'd 225 produces primarily innocuous lower-order distortion products.

Fig.7
Finally, the intermodulation spectrum produced when the 225 was asked to reproduce a combination of 19kHz and 20kHz at 48V p–p into 8 ohms (37W RMS) is shown in fig.7. The 1kHz intermodulation product (20kHz–19kHz) is moderately well suppressed, being nearly 57dB below the test signal, just above 0.1%. The 18kHz and 21kHz components are also reasonably low for a tubed amplifier.—Robert Harley
NEXT: KT90 Measurements »
|
|
| ||||||||||
- Log in or register to post comments


| Loudspeakers Amplification Digital Sources | Analog Sources Accessories Featured | Music Columns Retired Columns | Show Reports | Features Latest News Community | Resources Subscriptions |
 © 2024 Stereophile
AVTech Media Americas Inc., USA
All rights reserved

