| Columns Retired Columns & Blogs |
VAC PA80/80 power amplifier Measurements
Sidebar 2: Measurements
All measurements for the VAC PA 80/80 were made with the load connected to its appropriate output tap; ie, 8 ohm load to the 8 ohm tap, etc. The VAC was warmed up for 1 hour at 1/3 of its rated power of 80W; it ran typically hot for a tube amplifier.
The PA 80/80's input impedance measured a high 96k ohms at 1kHz. The output impedance was also high, at between 3.3 and 3.5 ohms (from the 8 ohm tap), depending on frequency. The system frequency response will thus be highly dependent on the loudspeaker load. Voltage gain into 8 ohms measured 30.6dB. S/N ratio (ref. 1W into 8 ohms) measured 70.5dB, unweighted, over a bandwidth of 22Hz-22kHz; 70dB, unweighted, over a wider 10Hz-500kHz bandwidth; and 85dB, A-weighted. DC offset was 3.1mV in the left channel, 0.2mV in the right.
Fig.1 shows the PA 80/80's frequency response: it is quite flat with a resistive load—the slight rise above 20kHz doesn't result in a sharp peak at frequencies above those shown on the graph. With a simulated real load, however, we see the variations typical of an amplifier possessing a high output impedance; these will be audible, and their nature and degree will vary with the impedance characteristics of the loudspeaker used. Fig.2 shows the amplifier's response to a 10kHz squarewave. It indicates a slight overshoot and damped oscillation. The 1kHz squarewave response (not shown) shows the same slight overshoot, but it's damped immediately; the 1kHz squarewave is otherwise close to a textbook response. The VAC's crosstalk is shown in fig.3. We've seen better, but this is certainly more than adequate for full stereo performance.
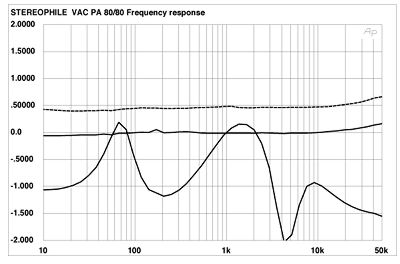
Fig.1 VAC PA80/80, frequency response at 1W into 8 ohms (top at 10kHz) and into simulated speaker load (right channel dashed, 0.5dB/vertical div.).

Fig.2 VAC PA80/80, small-signal 10kHz squarewave into 8 ohms.

Fig.3 VAC PA80/80, crosstalk (from top to bottom): L-R, R-L (10dB/vertical div.).
The manner in which the VAC's small-signal THD+noise varies with frequency (at 1kHz) is plotted in fig.4. While not remarkable, it's reasonable performance for a tube amplifier. Note, however, the rise at lower frequencies. The waveform of the distortion into a 4 ohm load at 1kHz is shown in fig.5. It's heavily second-harmonic, with some higher-order components. The 8 ohm and 2 ohm results (not shown) weren't substantially different; the higher-order components simply increase slightly as the load impedance is lowered.

Fig.4 VAC PA80/80, THD+noise vs frequency at (from top to bottom at 1kHz): 4W into 2 ohms, 2W into 4 ohms, 1W into 8 ohms, and 2.83V into simulated speaker load (right channel dashed).

Fig.5 VAC PA80/80, 1kHz waveform at 5W into 4 ohms (top); distortion and noise waveform with fundamental notched out (bottom, not to scale).
Fig.6 shows the spectrum of the VAC's output in response to a 50Hz input, taken at 53.5W output into a 4 ohm load (two-thirds of the amplifier's rated 80W). The distortion here is moderately (but not surprisingly) high, along with numerous AC-supply noise components. The second and third harmonics are dominant, at about -43dB (approximately 0.7%). The response at the same output into a simulated real load (not shown) actually shows slightly less distortion at 100Hz (-50dB or about 0.3%), but in general differed little (and in insignificant ways) from the 4 ohm result.

Fig.6 VAC PA80/80, spectrum of 50Hz sinewave, DC-1kHz, at 53.5W into 4 ohms (linear frequency scale). Note the presence of 60Hz harmonic components and that the second harmonic at 100Hz is the highest in level, at -43dB (about 0.7%).
Feeding a combined 19kHz+20kHhz signal into the VAC results in the spectral output content shown in fig.7. The level was 44.8W into 8 ohms—the maximum level obtained with this signal without visible signs of clipping. The result into 4 ohms (not shown) was very similar. This is a fair, if not special, result; the 1kHz component lies at -44.6dB (about 0.6%), the 18kHz component at -48dB (about 0.4%).

Fig.7 VAC PA80/80, HF intermodulation spectrum, DC-22kHz, 19+20kHz at 44.8W into 8 ohms (linear frequency scale).
The THD+noise vs output power measurements (fig.8) are unexceptional in that they're fairly typical of tube amplifiers, though with a slightly sharper "knee" than many. They are unusual in one respect, however, in that the results for 8, 4, and 2 ohms (taken from their respective output taps) are virtual overlays of each other. This is the first time I've ever seen this; I found it so unusual that I rechecked the next day—with the same result. This is of no significance I can imagine in actual performance terms, merely an interesting result.

Fig.8 VAC PA80/80, distortion (%) vs output power into 8 ohms, 4 ohms, and 2 ohms.
The actual clipping levels for the VAC are shown in Table 1. We present the values here for both the 1% and the 3% levels of THD+noise.
This is a fairly average set of measurements for a tube amplifier. As always, the main item for concern is the high output impedance, which makes this amplifier one which must be carefully matched to the partnering loudspeaker. As such, it is not dissimilar to the Jadis 300B reviewed elsewhere in this issue. The VAC, in fact, has an even higher output impedance than the Jadis. The VAC's saving grace is that its other measured results are far superior.—Thomas J. Norton
| Table 1 VAC PA80/80 | |||
| Discrete Clipping Levels (1% & 3% THD+Noise at 1kHz) | |||
| LOAD | Both Channels Driven | One Channel Driven | |
| ohms | W (dBW) | W (dBW) | |
| (L) | (R) | (L) | |
| 8 (1%) | 67.3 (18.3) | 75.6 (18.8) | 88.8 (19.5) |
| line | 115V | 116V | 115V |
| 8 (3%) | 76.5 (18.8) | 82.3 (19.2) | 94.9 (19.8) |
| line | 116V | 116V | 115V |
| 4 (1%) | 55.5 (14.4) | 55.5 (14.4) | 89.3 (16.5) |
| line | 117V | 116V | 117V |
| 4 (3%) | 85.6 (16.3) | 80.8 (16.1) | 95.3 (16.8) |
| line | 115V | 116V | 117V |
| 2 (1%) | 87.4 (13.4) | ||
| line | 116V | ||
| 2 (3%) | 93.8 (13.7) | ||
| line | 116V | ||
|
|
| ||||||||||
- Log in or register to post comments


| Loudspeakers Amplification Digital Sources | Analog Sources Accessories Featured | Music Columns Retired Columns | Show Reports | Features Latest News Community | Resources Subscriptions |
 © 2024 Stereophile
AVTech Media Americas Inc., USA
All rights reserved

