A Transport of Delight: CD Transport Jitter Page 3

Jitter plots
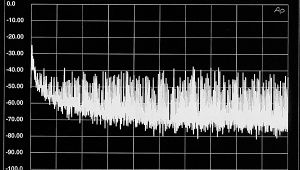
A typical jitter-measurement plot is shown in fig.4, measured on the highest-jitter source I found: the Panasonic SV-3700 professional DAT machine (a Stereophile-owned sample). The horizontal scale is frequency in Hz, the vertical scale is amplitude in volts. The vertical scale is calibrated so that the "100u" at the bottom is equivalent to 1ps, the "1m" a third of the way up is 10ps, the "10m" point is 100ps, and "0.1" is 1000ps, or one nanosecond (1ns). Note that the vertical amplitude (jitter) scale is logarithmic. Below the "1m" division, each horizontal division equals 1ps. Between "1m" and "10m," each horizontal division is 10ps. Between "10m" and "0.1," each horizontal division is 100ps. The topmost division—0.1 to 0.2—equals 1ns (1000ps). Differences in the trace levels toward the graph top represent much more of a difference in jitter levels than those at the graph bottom. Incidentally, you can't infer the overall RMS jitter level from looking at where the trace lies; it takes some complicated math to make that conversion. Instead, I've presented the RMS jitter levels for each product with each test signal in Table 1.

Fig.4 Panasonic SV-3700 DAT recorder, jitter in S/PDIF data signal, 20Hz-50kHz, when transmitting digital silence (bottom solid trace), a 1kHz sinewave at -90dB (middle, dashed trace), and a 1kHz sinewave at 0dBFS (top, light dotted trace) (vertical scale, 1ps-2ns, 100µV = 1ps).

The solid trace in fig.4 is the SV-3700's jitter when transmitting digital silence (track 4 on the CBS Test CD), the heavy dotted trace is the jitter spectrum when the transport is transmitting a -90dB, 1kHz sinewave, and the lightest (top) trace is made with a 1kHz, 0dB sinewave. Note that the jitter isn't randomly distributed with frequency: the spikes in the trace at 100Hz and multiples of 100Hz indicate that there are jitter components with energy at those frequencies. Moreover, we see a huge change in the jitter level and spectrum with different test signals. The jitter's "signature" is quite different with low- and high-level signals.

Fig.5 is the SV-3700's jitter spectrum when playing the two musical selections. The RMS levels are: 4250ps (0dB, 1kHz signal), 1110ps (-90dB, 1kHz signal), and 180ps (digital silence). The musical selections have an RMS jitter value of 3830ps for music #1 (Firebird) and 3800ps for music #2 (Steve Morse) (footnote 5).

Fig.5 Panasonic SV-3700 DAT recorder, jitter in S/PDIF data signal, 20Hz-50kHz, when transmitting music #1 (Firebird, solid) and music #2 (Steve Morse, dashed) (vertical scale, 1ps-2ns, 100µV = 1ps).

For contrast, Fig.6 is the PS Audio Lambda's jitter spectrum with the same test signals. The RMS jitter level was 51ps (worst case) and 29ps (best case). The musical signals produced the jitter plots in fig.7, which had RMS jitter values of 66ps (music #1) and 37ps (music #2). Note how the low-level musical source produced more jitter than the high-level one. The Lambda and SV-3700 are representative of very good and very poor S/PDIF jitter performance (footnote 6).

Fig.6 PS Audio Lambda, jitter in S/PDIF data signal, 20Hz-50kHz, when transmitting digital silence (bottom solid trace), a 1kHz sinewave at -90dB (middle, dashed trace), and a 1kHz sinewave at 0dBFS (top, light dotted trace) (vertical scale, 1ps-2ns, 100µV = 1ps).

Fig.7 PS Audio Lambda, jitter in S/PDIF data signal, 20Hz-50kHz, when transmitting music #1 (Firebird, solid) and music #2 (Steve Morse, dashed) (vertical scale, 1ps-2ns, 100µV = 1ps).

Jitter Bugs
As described by Dr. Fourré in his article last month, the jitter from a transport and interface is highly correlated with the encoded audio signal. If the transport is putting out the digital code representing a 1kHz sinewave, we see additional jitter energy at 1kHz. The large peak seen in some plots between 7kHz and 8kHz is the subcode carried in the S/PDIF data stream. Subcode is non-audio data such as track time, track number, and whether the data have been pre-emphasized. The data rate for each subcode channel is 7.35kHz, producing jitter at 7.35kHz.

The signal-correlated jitter is greatest when the test signal is lowest in amplitude. Low-level signals produce a greater number of bit transitions than high-level signals, which induce more jitter in the interface. (Dr. Fourré explained the mechanism behind this last month.)

Before proceeding to the test results, I must caution readers not to jump to conclusions about a transport's sound quality from these measurements. Although the UltraAnalog jitter analyzer is a very sensitive and accurate instrument, there are several factors beyond the transport's intrinsic jitter than can affect a digital front-end's sonic characteristics. First, a particular digital processor may present a different impedance from the jitter analyzer's tightly specified and correct impedance. Second, the clock-recovery performance of different digital processors varies greatly, affecting the jitter spectrum and level in the recovered clock. Another variable is the different comparators used in the input circuits of different products. All these factors may affect the jitter level and spectrum passed to the recovered clock in an unknown way.

Finally, different DAC architectures (1-bit and multi-bit) respond differently to different jitter levels and the spectral distribution of that jitter. The identical word-clock jitter could produce different sonic effects, depending on the DAC and the manner in which its word clock has been recovered. Consequently, the measurements presented here should be viewed on a comparative basis only, not as an absolute quantification of a transport's intrinsic sound quality. Further, these measurements are so new that we don't fully understand how differences in measured performance affect musical perception.

With that caveat, here is how some popular CD transports performed on this new test.

Measurement surprises
I had planned to try measuring jitter differences in digital interconnects only after I'd finished measuring transports. If there were measurable differences in cables, I thought they would be revealed only by averaging many measurements with each cable (to reduce the influence of random noise), and then processing the data to uncover the tiniest of differences. The System One has a "Compute Delta" function that extracts only the difference between two measurements. My preconception was that any measurable differences between different coaxial digital interconnects would be marginal at best.


Footnote 5: The curves and RMS jitter measurements mistakenly presented in my August "Industry Update" (p.49) as belonging to the SV-3700 were actually the measurements on a Philips CD960 CD player, provided by UltraAnalog.—Robert Harley

Footnote 6: It's ironic that the SV-3700—perhaps the most popular professional digital recorder ever made—has vastly higher jitter from its S/PDIF output than even inexpensive high-end consumer products—products designed by ear. The professional audio world may look down on "consumer" equipment, but it often sounds much better than professional gear.—Robert Harley

COMMENTS
p_f_m's picture

Hi, first of all thank you very much for doing this. It is very informative and I appreciate your time and efforts you spent on this. I do have a couple of questions though -

For the audibility tests, did you test the players/sources using the same outboard dac via spdif ? or were you listening to the analog outputs of the playback sources ?

Comparing the worst v/s the best is a great way of highlighting the differences and to educate users how jitter sounds like, however I feel it would have been perfect, especially after having spent the time and effort to come this far anyway, if you could have also thrown in to the listening test one or two players that had "average" or not too bad or good jitter. This would have kind of helped understand approximately whereabouts might be the threshold of audibility of jitter.

Thank you! and looking forward to hearing from you.

-PFM.

X