| Columns Retired Columns & Blogs |
Tannoy Churchill loudspeaker Measurements part 2
The slight peakiness in the presence region ties in nicely with Barry's criticism of grain in the low treble. In the bass, the nearfield response is down 6dB at 24Hz and 10dB at 20Hz, which is good if not outstanding low-frequency extension.
Due to the Tannoy's mass, I was not able to position it on my turntable to examine its off-axis behavior. But by moving the microphone instead, I could get a handle on its dispersion, which should be similar in both planes due to its coaxial drive-unit design. Fig.5 shows the vertical dispersion, plotted at approximate 5 degrees intervals from 20 degrees above the tweeter axis to 10 degrees below. There is very little change over almost all the band across this window, which correlates with the good imaging performance. But note that, above 10kHz, the response drops rapidly at more than 15 degrees off-axis. This will lead to a lack of top-octave energy in all but very live rooms, which will also contribute to the Churchill's dark tonal balance.

Fig.5 Tannoy Churchill, vertical response family at 50", normalized to response on tweeter axis, from back to front: differences in response 20 degrees-5 degrees above HF axis; reference response; differences in response 5 degrees-10 degrees below HF axis.
In the time domain, the Tannoy's impulse response (fig.6) looks typical of a design that uses a high-order crossover. Indeed, the step response (fig.7) confirms my suspicion from the impulse response that the Churchill is not time-coherent, despite its use of a coaxial drive-unit that places the tweeter diaphragm close to the acoustic center of the woofer. The tweeter output arrives at the measuring microphone first, followed by the woofer output.

Fig.6 Tannoy Churchill, impulse response on tweeter axis at 50" (5ms time window, 30kHz bandwidth).
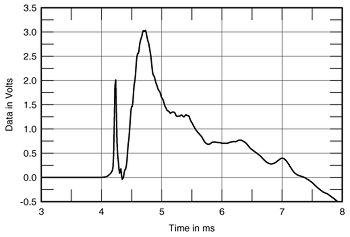
Fig.7 Tannoy Churchill, step response on tweeter axis at 50" (5ms time window, 30kHz bandwidth).

Fig.8 Tannoy Churchill, cumulative spectral-decay plot at 50" (0.15ms risetime).
Finally, the Churchill's cumulative spectral-decay plot (fig.8) is not that clean, but I suspect that most of the hash visible is due to early reflections rather than to resonances per se. But not the ridge of delayed energy at the cursor position at 4kHz—this is a resonance, and probably contributed to BW finding that the speaker sounded a little grainy in this region.—John Atkinson
|
| ||||||||||
- Log in or register to post comments


| Loudspeakers Amplification Digital Sources | Analog Sources Accessories Featured | Music Columns Retired Columns | Show Reports | Features Latest News Community | Resources Subscriptions |
 © 2024 Stereophile
AVTech Media Americas Inc., USA
All rights reserved

