| Columns Retired Columns & Blogs |
TAD Evolution One loudspeaker Measurements
Sidebar 3: Measurements
I used DRA Labs' MLSSA system and a calibrated DPA 4006 microphone to measure the TAD Evolution One's frequency response in the farfield, and an Earthworks QTC-40 for the nearfield responses. For the farfield measurements, I left in place the grilles that cover the woofers and the coaxial midrange and high-frequency drivers.
The Evolution One is specified as having a voltage sensitivity of 88dB/2.83V/m. My estimate was almost 1dB higher than this, at 88.9dB(B), which is usefully higher than average. The impedance magnitude (fig.1, solid trace) remains between 4 and 6 ohms for most of the bass and middle ranges, and there is a demanding combination of 5 ohms and –50° electrical phase angle at 27Hz. A good 4 ohm-rated amplifier would be the best choice to drive the TAD. The traces in fig.1 are free from the small discontinuities that would imply the presence of cabinet resonances. Investigating the panels' vibrational behavior with a piezoelectric plastic accelerometer, I found just a couple of low-level modes, at 367 and 453Hz, on the side panels (fig.2). This is a rigid but well-damped enclosure.
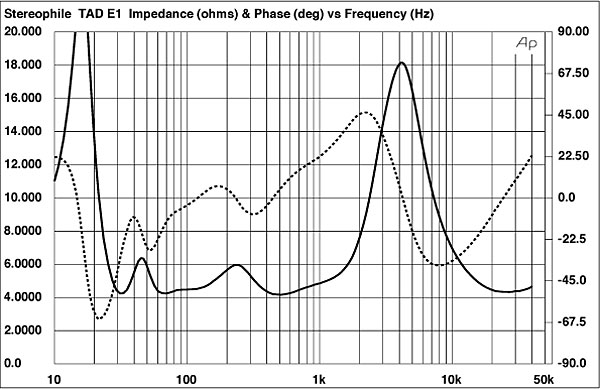
Fig.1 TAD Evolution One, electrical impedance (solid) and phase (dashed) (2 ohms/vertical div.).
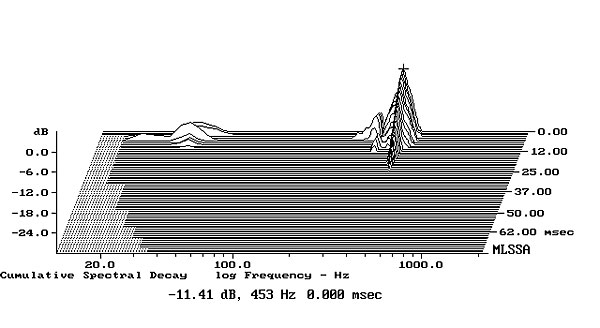
Fig.2 TAD Evolution One, cumulative spectral-decay plot calculated from output of accelerometer fastened to center of side panel level with midrange unit (MLS driving voltage to speaker, 7.55V; measurement bandwidth, 2kHz).
The saddle in the impedance-magnitude trace just above 30Hz suggests that this is the frequency at which the TAD's large rectangular port is tuned. The woofers have identical responses, and the minimum-motion notch in their combined nearfield output (fig.3, blue trace), which is where the back pressure from the port resonance holds the cones stationary, occurs at a sharply defined 36Hz. The port output (red trace) peaks as expected between 25 and 50Hz, and though there is a slight peak at 150Hz in its upper-frequency rolloff, this is well suppressed. The woofers roll out with a high-order slope, crossing over to the midrange driver (green trace below 2kHz) at pretty much the specified 250Hz. The midrange driver rolls in with what appears to be a fourth-order, 24dB/octave slope. Higher in frequency, the Evolution One's response on its tweeter axis is remarkably flat through the midrange to the mid-treble, with some peaks and dips above those regions that result from the symmetrical acoustic environment seen by the coaxially mounted tweeter.
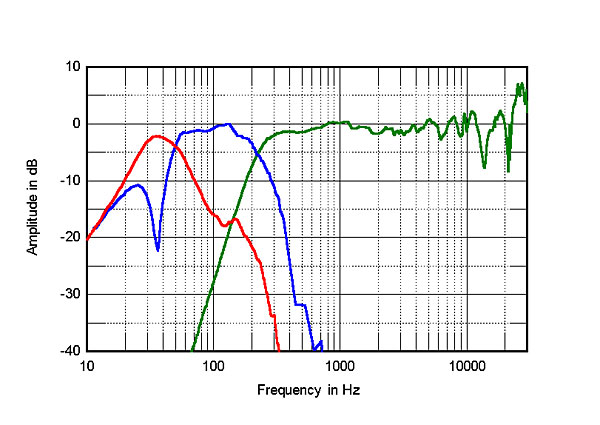
Fig.3 TAD Evolution One, acoustic crossover on HF axis at 50", corrected for microphone response, with nearfield responses of woofers (blue), port (red), and midrange unit (green), respectively plotted below 700, 325, and 400Hz.
Fig.4 shows how these individual responses sum in the farfield, averaged across a 30° horizontal angle centered on the tweeter axis. The top-octave peaks and dips are less severe in this averaged response, and again, the TAD's response is remarkably even. I am not surprised that Kal Rubinson was impressed by what he heard as the speaker's natural, uncolored reproduction of voices. KR also commented on the Evolution One's tight but full low frequencies, which is what I would have expected from the low-frequency behavior in fig.4. There is only a slight peak in the midbass that results from the nearfield measurement, implying a low-Q woofer alignment; and the output extends at full level to 40Hz, with then a drop to –6dB just below the port tuning frequency.
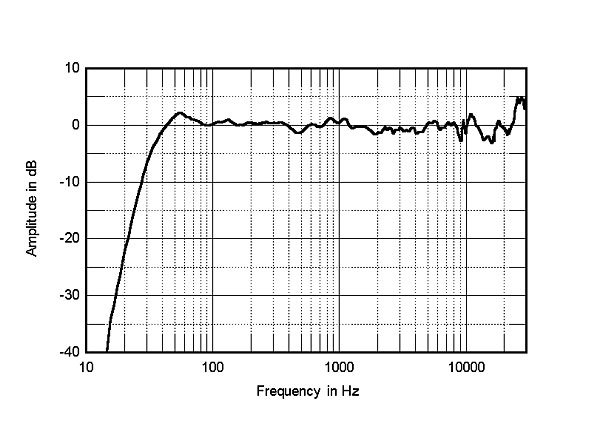
Fig.4 TAD Evolution One, anechoic response on HF axis at 50", averaged across 30° horizontal window and corrected for microphone response, with complex sum of nearfield responses plotted below 300Hz.
The plot of the Evolution One's lateral dispersion, referenced to the response on the tweeter axis (fig.5), indicates that the on-axis peaks and dips in the high treble tend to even out to the speaker's sides. The radiation pattern is commendably smooth and even through the midrange and low to mid-treble, something that always correlates with stable, well-defined stereo imaging. The dispersion is also even and well controlled in the vertical plane (fig.6), a benefit of the coaxial midrange-tweeter arrangement.
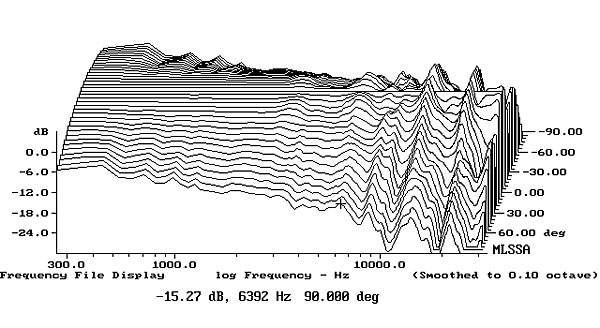
Fig.5 TAD Evolution One, lateral response family at 50", normalized to response on HF axis, from back to front: differences in response 90–5° off axis, reference response, differences in response 5–90° off axis.
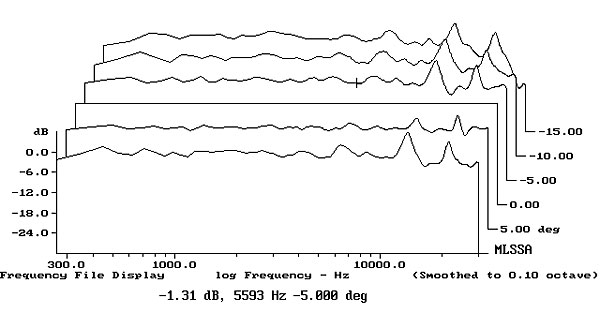
Fig.6 TAD Evolution One, vertical response family at 50", normalized to response on HF axis, from back to front: differences in response 15–5° above axis, reference response, differences in response 5–10° below axis.
In the time domain, the TAD's step response on its tweeter axis (fig.7) indicates that all four drive-units are connected with positive acoustic polarity, with the tweeter's output arriving first at the microphone, followed by the midrange unit's output, then the woofers'. Most important, the decay of each unit's step blends smoothly with the start of that of the next lower in frequency, which confirms optimal crossover design. The cumulative spectral-decay plot on the tweeter axis (fig.8) is less clean than I expected, but it's fair to note that KR didn't comment on any grain or lack of clarity in the treble.
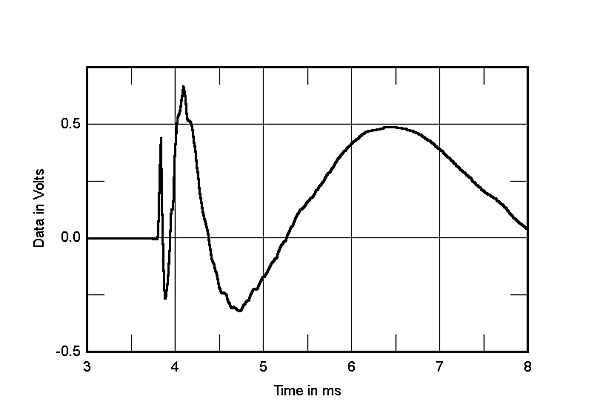
Fig.7 TAD Evolution One, step response on HF axis at 50" (5ms time window, 30kHz bandwidth).
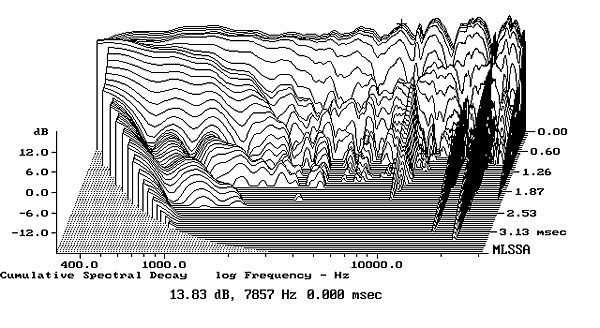
Fig.8 TAD Evolution One, cumulative spectral-decay plot on HF axis at 50" (0.15ms risetime).
Kal concluded that the Evolution One is a "marvelous" loudspeaker. Its measured performance leads me to agree.—John Atkinson
|
| ||||||||||
- Log in or register to post comments


| Loudspeakers Amplification Digital Sources | Analog Sources Accessories Featured | Music Columns Retired Columns | Show Reports | Features Latest News Community | Resources Subscriptions |
 © 2024 Stereophile
AVTech Media Americas Inc., USA
All rights reserved

