| Columns Retired Columns & Blogs |
T+A V10 integrated amplifier Measurements
Sidebar 3: Measurements
It proved a little tricky to arrange the optimal grounding between the T+A V10 and my Audio Precision test gear. However, I eventually succeeded in eliminating a residual low-level hum, and left the amplifier driving a 1kHz sinewave into 8 ohms for an hour at 30W, to get everything warmed up. I checked the bias after that period using the front-panel LCD screen. The left channel was one notch below maximum bias, the right channel smack dab in the middle of the recommended range, which the manual suggested was optimal. However, the left channel featured more than twice the distortion of the right, suggesting that a tube had got damaged in shipping. (Two power tubes had worked themselves loose when I unpacked the amplifier.) I therefore continued by measuring the right channel alone.
The voltage gain with the volume control wide open was a high 43.6dB from the 8 ohm output transformer tap, 41dB from the 4 ohm tap. The amplifier preserved absolute polarity, and the input impedance was approximately 12k ohms across the band. The output impedance was usefully low for a tube design, at 0.75 ohm in the bass and midrange from the 4 ohm output, this increasing slightly to 0.95 ohm at 20kHz. The figures for the 8 ohm tap were still quite low, at 1.2 and 1.75 ohms, respectively.
With this lowish source impedance, there will be only moderate frequency-response modification due to the interaction with the loudspeaker's modulus of impedance. The top trace in fig.1, for example, was taken with the V10's 4 ohm tap driving our simulated two-way loudspeaker; the variations in response are around ±0.5dB. What is more interesting in this graph is that the amplifier's small-signal bandwidth depends on the load impedance. Into 8 ohms (top trace above 20kHz), the 3dB-down point lies at around 150kHz, which is extraordinary for a tube design (though some very slight peaking is evident at 50kHz). Into 4 ohms, the ultrasonic output drops to a still astonishing -3dB at 120kHz, but into 2 ohms, the response is now down 3dB at 52kHz, -0.6dB at 20kHz. The bandwidth also decreases at the other end of the spectrum, though not to anything like the same degree. Even into 2 ohms, the T+A amplifier is flat down to 30Hz, -1dB at 13.5Hz. The bandwidth was more curtailed from the 8 ohm tap (Fig.2), with the ultrasonic response measuring -3dB at 100kHz into 8 ohms and at 30kHz into 2 ohms.

Fig.1 T+A V10, 4 ohm tap, frequency response at (from top to bottom at 2kHz): 2.83V into simulated loudspeaker load, 1W into 8 ohms, 2W into 4 ohms, 4W into 2 ohms (1dB/vertical div.).

Fig.2 T+A V10, 8 ohm tap, frequency response at (from top to bottom at 2kHz): 2.83V into simulated loudspeaker load, 1W into 8 ohms, 2W into 4 ohms, 4W into 2 ohms (1dB/vertical div.).
As a result of its commendably wide bandwidth, the V10's reproduction of 10kHz (fig.3) and 1kHz (fig.4) squarewaves was excellent, though with just a hint of some overshoot, which was dependent on the load impedance. (The higher the load impedance, the greater the overshoot.) Channel separation (not shown) was excellent in the midband, though the usual capacitive coupling reduced the figure to 50dB at 20kHz. The T+A's unweighted signal/noise ratio, taken with the input short-circuited but the volume control at its maximum, was good rather than great at 62.3dB ref. 1W into 8 ohm, 8 ohm tap (10Hz-500kHz measurement bandwidth). Applying an A-weighting filter improved this figure to 73.6dB, due to the elimination of both some ultrasonic noise and some very-low-frequency components.
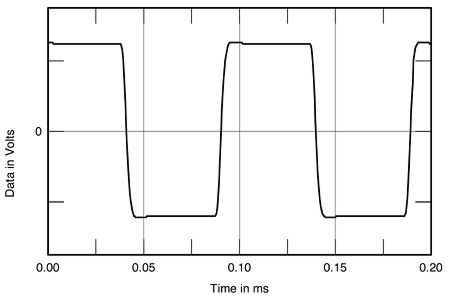
Fig.3 T+A V10, 8 ohm tap, small-signal 10kHz squarewave into 8 ohms.
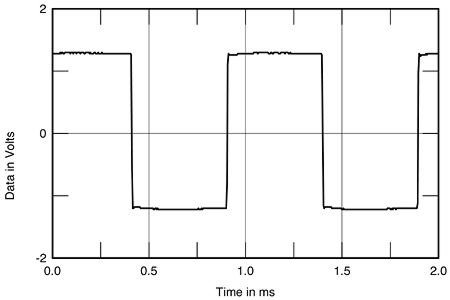
Fig.4 T+A V10, 8 ohm tap, small-signal 1kHz squarewave into 8 ohms.
Figs.5 and 6 show how the percentage of THD and noise in the V10's output varies with output power into loads ranging from 2 to 16 ohms, from the 8 and 4 ohm taps, respectively. Defining clipping as 1% THD+noise, the T+A amplifier exceeded its specified 80W power specification (19dBW) as long as the load impedance was equal to or less than the nominal output transformer tap. These two graphs also show that, below the actual clipping point, the THD percentage rises steadily with increasing power. While this is not anything like the level typical of single-ended tube amplifiers, it does point to the tradeoff incurred by the designers' decision to use minimal loop negative feedback.
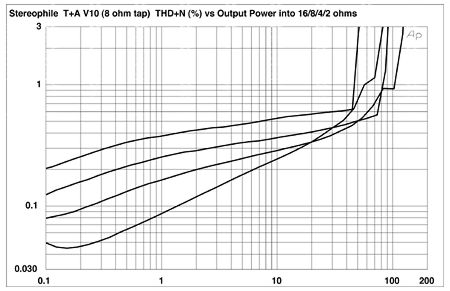
Fig.5 T+A V10, 8 ohm tap, distortion (%) vs 1kHz continuous output power into (from bottom to top at 1W): 16 ohms, 8 ohms, 4 ohms, 2 ohms.
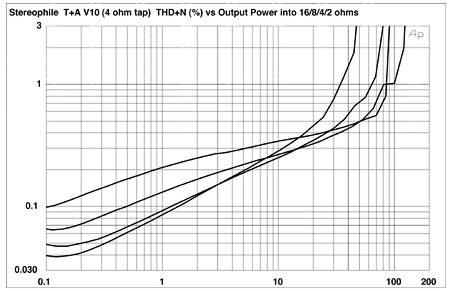
Fig.6 T+A V10, 4 ohm tap, distortion (%) vs 1kHz continuous output power into (from bottom to top at 1W): 16 ohms, 8 ohms, 4 ohms, 2 ohms.
However, these graphs also reveal that the V10 is a very linear design at low powers, especially into high impedances. Into 16 ohms from the 4 ohm tap, for example, the amplifier offers just 0.038% THD+N at 150mW, which is the level the amplifier will be cruising at much of the time with real music. Note also from these graphs that reducing the load impedance increases the overall level of THD. This can also be seen in fig.7, which plots the THD+N percentage against frequency at 2.83V into 16 ohms (bottom trace) and 8, 4, and 2 ohms (top trace). The distortion drops off at the frequency extremes, more so into low impedances, which I imagine correlates with the bandwidth changes noted above.
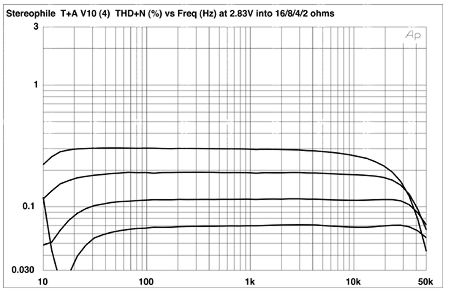
Fig.7 T+A V10, 4 ohm tap, THD+N (%) vs frequency (from bottom to top): 2.83V into 16 ohms, 8 ohms, 4 ohms, 2 ohms.
At low levels into moderate impedances, the distortion is dominated by the subjectively benign second harmonic (fig.8). But as shown by a spectral analysis of the output at this level (fig.9), higher harmonics are present, albeit at very low levels. As the power level increases, though, these harmonics increase to levels where they start to become audible, especially the fifth (fig.10). The picture was similar with high powers at low frequencies (fig.11), with again the fifth harmonic the highest in level after the second and third. Even so, the V10 performed quite well on the high-level, high-frequency intermodulation test (fig.12), which was taken just below visible waveform clipping on the oscilloscope screen. The 1kHz difference component lies at -54dB (0.2%), but the other intermodulation components remain below -70dB (0.03%).
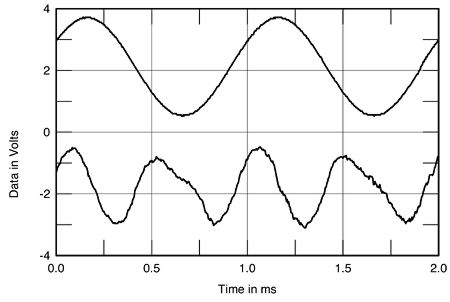
Fig.8 T+A V10, 8 ohm tap, 1kHz waveform at 1W into 8 ohms (top), 0.15% THD+N; distortion and noise waveform with fundamental notched out (bottom, not to scale).
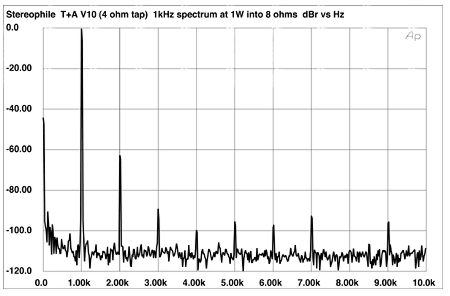
Fig.9 T+A V10, 4 ohm tap, spectrum of 1kHz sinewave, DC-1kHz, at 1W into 8 ohms (linear frequency scale).
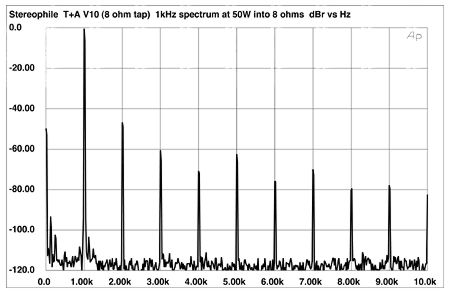
Fig.10 T+A V10, 8 ohm tap, spectrum of 1kHz sinewave, DC-1kHz, at 50W into 8 ohms (linear frequency scale).
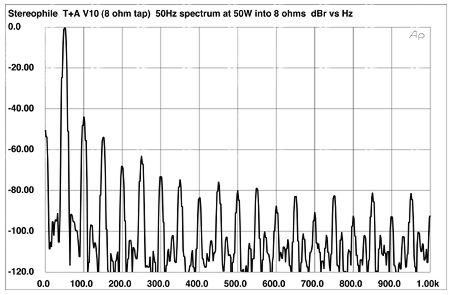
Fig.11 T+A V10, 8 ohm tap, spectrum of 50Hz sinewave, DC-1kHz, at 50W into 8 ohms (linear frequency scale).
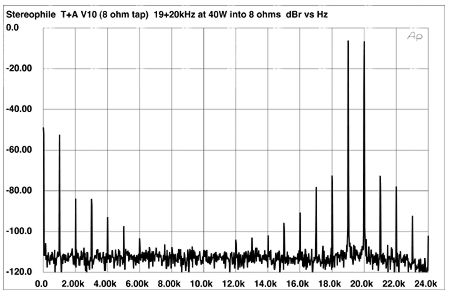
Fig.12 T+A V10, 8 ohm tap, HF intermodulation spectrum, DC-24kHz, 19+20kHz at 40W into 8 ohms (linear frequency scale).
The V10's unusual output stage appears to offer benefits that include an unusually wide bandwidth for a transformer-coupled amplifier and respectable linearity at low-moderate power levels into higher impedances, despite the absence of high levels of overall negative feedback. But at high powers and especially driving low impedances, the V10 will introduce varying levels of harmonic products that might well correlate with MF's finding the amplifier to sound a little "crisp."—John Atkinson
|
| ||||||||||
- Log in or register to post comments


| Loudspeakers Amplification Digital Sources | Analog Sources Accessories Featured | Music Columns Retired Columns | Show Reports | Features Latest News Community | Resources Subscriptions |
 © 2024 Stereophile
AVTech Media Americas Inc., USA
All rights reserved

