| Columns Retired Columns & Blogs |
Siltech SAGA power amplifier Measurements
Sidebar 3: Measurements
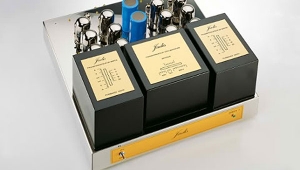
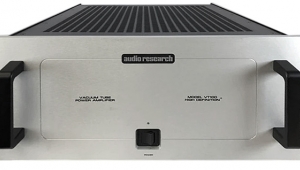
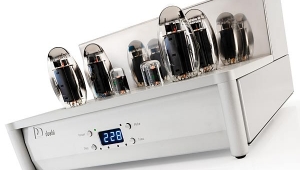
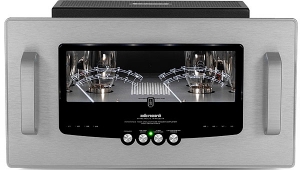
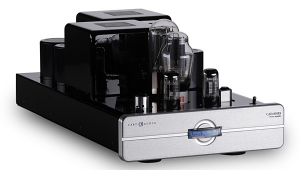
I measured the Siltech SAGA using my Audio Precision SYS2722 system (see www.ap.com, and the January 2008 "As We See It"). When I received from Michael Fremer the Siltech SAGA V1 voltage amplifier and P1 current amplifier, I hoisted the two chassis up onto my test bench—easier to write than to do, given that each weighs 53 lbs—and linked them with a pair of XLR interconnects. Although the SAGA's XLR jacks are wired for single-ended operation, with pins 1 and 3 shorted, Siltech recommends using cables fitted with XLRs, presumably due to the fact that these, when plugged in, make the ground connection before the signal connection, thus avoiding potentially damaging pulses. I plugged the V1's charger into the wall, made sure the V1's batteries were charged, then turned both units on—only to run into a problem.
I was getting signal from only the left pair of speaker terminals. This was the case whether I ran the V1 voltage amplifier in pentode or triode modes. I replaced the cables, with no change. I then swapped cables from left to right for both the input from the signal generator and for the links joining the chassis, fed signal directly to the P1 current amplifier, then looked at the V1's outputs. It became apparent that the fault was with the V1's right channel; presumably, something untoward had happened when Michael Fremer shipped the SAGA components to me for measurement. As the left channel of this sample, serial number 02, appeared to be working correctly, according to the published specifications, I continued, measuring only that channel.
Before performing any measurements on an amplifier, I usually run it for an hour at one-third its specified maximum power into 8 ohms, which is thermally the worst case for an amplifier with a class-B or -AB output stage. Although Siltech claims for the SAGA a maximum output of 380Wpc into 8 ohms, both Paul Miller's measurements in the June 2013 issue of British magazine Hi-Fi News and my own measurement of this sample suggest that 300Wpc is more typical. I therefore set the single channel driving 100W into 8 ohms, and sat back to wait for the hour's preconditioning to conclude. (The amplifier was well-ventilated on the test bench.)
But after only 10 minutes, the P1 turned itself off. I turned it back on, but the P1's mute wouldn't lift. The P1's heatsinks are internal; the top panel was warm to the touch, at 105.4°F (40.8°C), but according to the manual, the muting meant that the amplifier had overheated, and that it would not operate again until it had cooled down. After it had done so, I continued measuring.
The SAGA combination's voltage gain, measured into 8 ohms, depended on the V1's tube mode. It was a high 33.4dB in pentode mode, but almost 6dB lower, at 27.7dB, in triode mode—both close to the specified figures. The P1 alone attenuated input signals by 0.4dB. The SAGA amplifier as a whole inverted signal polarity in both modes, though the P1 alone preserved absolute polarity (ie, was non-inverting), as you would expect from a voltage-follower circuit.
The V1's input impedance was extremely high in both triode and pentode modes at low and middle frequencies, at 500k ohms or so. (The voltage-drop method I use to measure input impedance can give only approximate results with input impedances above 100k ohms.) It dropped at 20kHz to 140k ohms in triode and 76k ohms in pentode, but these figures are still sufficiently high that the V1 won't load the preamplifier in use to any significant extent. The P1's input impedance was also very high, at almost 200k ohms at 20Hz and 1kHz, but dropped again to 76k ohms at 20kHz.
The P1's output impedance was higher than is usual for a solid-state design, at 0.23 ohm, which resulted in a mild, ±0.13dB modulation of the system's frequency response in both pentode (fig.1, gray trace) and triode (fig.2, gray) modes. However, this variation is superimposed on a raised treble plateau that reaches +0.13dB in triode and +0.4dB in pentode. Although this high-frequency lift is small, it covers a sufficiently wide frequency range that it should be audible, at least in pentode mode. Note also that the complete SAGA has a wider ultrasonic response in triode mode than in pentode, especially into 8 ohms (fig.2, blue trace)—an even wider bandwidth than the P1 alone (fig.3). The P1's response is flat within the audioband, meaning that the treble plateau in the system response comes from the V1. This leads to a small amount of leading-edge overshoot in the shape of a 10kHz squarewave (fig.4).
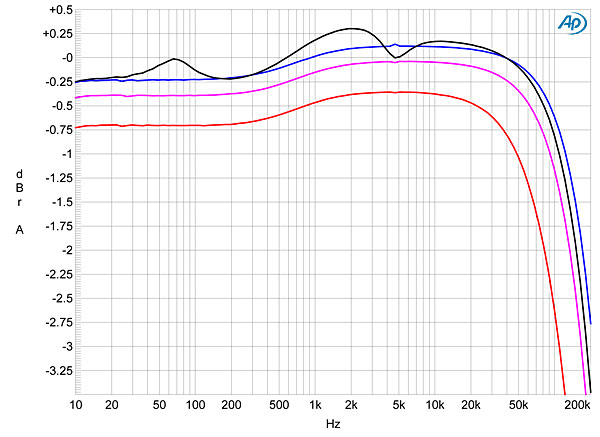
Fig.1 Siltech SAGA, original sample, V1 in pentode mode, frequency response at 2.83V into: simulated loudspeaker load (gray), 8 ohms (blue), 4 ohms (magenta), 2 ohms (red) (0.5dB/vertical div.).
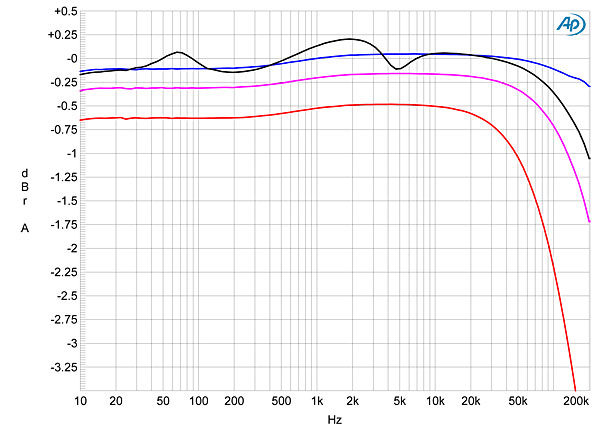
Fig.2 Siltech SAGA, original sample, V1 in triode mode, frequency response at 2.83V into: simulated loudspeaker load (gray), 8 ohms (blue), 4 ohms (magenta), 2 ohms (red) (0.5dB/vertical div.).
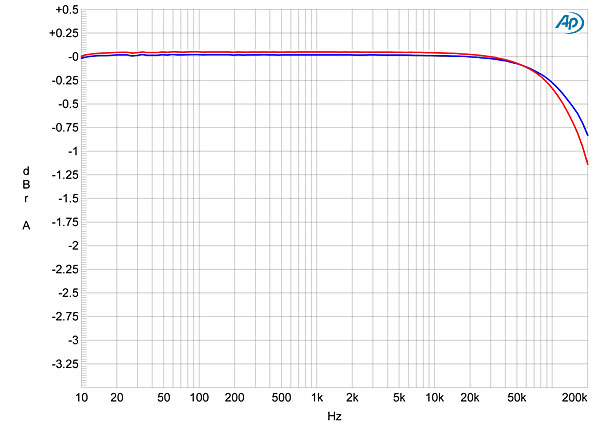
Fig.3 Siltech SAGA, original sample, P1 alone, frequency response at 2.83V into 8 ohms (left channel blue, right red) (0.5dB/vertical div.).
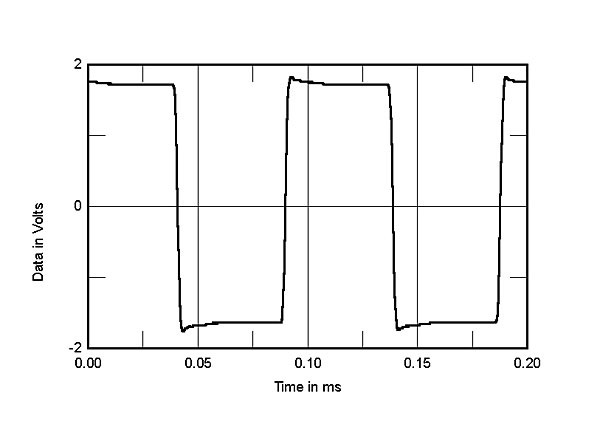
Fig.4 Siltech SAGA, original sample, V1 in triode mode, small-signal 10kHz squarewave into 8 ohms.
Siltech's rationale for splitting the power amplifier into separate voltage- and current-amplifier chassis is that this minimizes noise. They specify very high signal/noise ratios: 128dB for the V1 in triode, 138dB for the P1, both measurements IHF-A. I couldn't measure ratios this high for the SAGA as a whole, though that may have been because my S/N reference is 2.83V, which is the voltage-output equivalent of 1W into 8 ohms. With the V1's input shorted, the SAGA's wideband, unweighted S/N was 70.8dB in pentode, 78.8dB in triode. Restricting the measurement bandwidth to the audioband respectively increased these ratios to 79.2 and 97.1dB, while A-weighting further increased them to 81.8 and 101.6dB. If Siltech's ratio is referred to maximum power rather than 1W, the latter ratios get very close to the specified 128dB.
Fig.5 compares the low-frequency spectrum of the SAGA's noise floor when the V1's input is shorted (blue trace) with the spectrum when the entire SAGA, in triode mode, drives a 1kHz tone at 1W into 8 ohms (red trace). Spuriae at 60Hz and its harmonics appear with the amplifier passing signal, with 60Hz the highest in level, at –80dB (0.01%). Repeating the spectral analysis with the P1 alone revealed that the P1 is much quieter than the V1, with power-line harmonics 30dB lower than with the P1 driven by the V1.
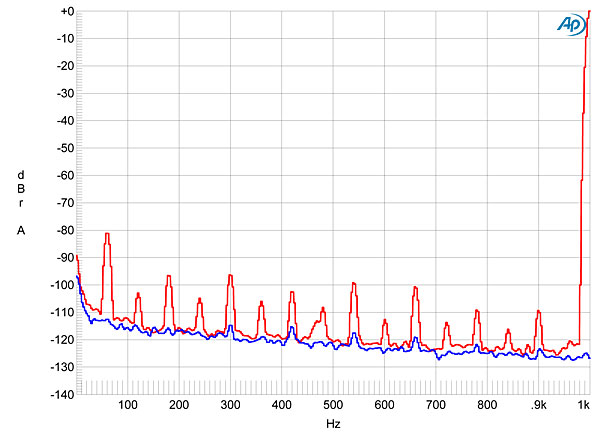
Fig.5 Siltech SAGA, original sample, V1 in triode mode, spectrum of 1kHz sinewave, DC–1kHz, at 1W into 8 ohms (red), and with V1 input shorted (blue) (linear frequency scale).
Siltech's specifications for the SAGA reveal a higher-than-usual amount of harmonic distortion, but my measurements were much worse than those specs. Concerned that this sample of the P1, serial no.12, may have been faulty, I discussed my measurements with Siltech's Edwin Rynveld. It turned out that our sample of the P1 was from the first production run, and that a part used in the P1's optical Apollo circuit had suffered a 100% failure rate in the field. It worked correctly when first operated, so that the amplifier would pass testing in manufacturing, but over time it would slowly fail, starving the P1's output stage of bias current. Ultimately, without any bias, the P1 would be operating in class-B, hence the very high levels of distortion that I measured, with the residual distortion waveform featuring high levels of crossover distortion (fig.6).
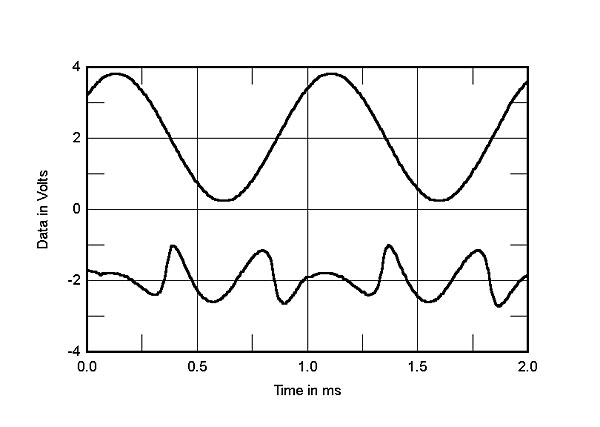
Fig.6 Siltech SAGA, original sample, V1 in pentode mode, 1kHz waveform at 8W into 4 ohms, 0.271% THD+N (top); distortion and noise waveform with fundamental notched out (bottom, not to scale).
Given the failure of both the V1 and P1 samples on the test bench, I arranged to have them shipped back to Siltech and requested new samples. When these arrived, I set them up on the test bench. The distortion of the new sample of the P1 (serial no.16) was very much lower than the original sample (serial no.12), suggesting that the revised biasing scheme was working correctly. To ensure that everything was working correctly, I left the amplifier operating at a level of 2W into 8 ohms. However, after 20 minutes the amplifier turned itself off, apparently due to overheating. There had been no indication of instability, but the temperature of the bottom of the chassis was 104.7°F (40.4°C), and the internal heatsinks were presumably much hotter.
I let the P1 cool down before turning it on again. However, after 10 minutes at 1W into 8 ohms, an internal relay starting clicking, the output waveform was clipped even at this low signal level, and the P1's chassis was again very hot. Obviously, something had gone wrong with this sample, too.
I returned the V1 and P1 to Siltech and awaited new samples. When these arrived—the V1 was serial no.16; the P1 was the original sample, serial no.12, repaired and updated with the new optical part—I performed a full set of tests before driving them over to Michael Fremer's, so he could redo his auditioning.
The voltage gains, input and output impedances, frequency responses, channel separations, and S/N ratios of these samples were all very similar to the earlier ones, indicating manufacturing consistency. However, when I attempted to precondition the SAGA by running the combination with a 1kHz signal at a lower level than before, 20Wpc into 8 ohms, the P1 turned itself off after 25 minutes. Its top panel was hot, at 120.2°F (48.9°C). This time, however, after cooling down, the P1 continued to operate with no further problems, and I could continue testing.
The SAGA in pentode mode now offered respectably low distortion. Figs. 7 and 8 respectively plot the percentage of THD+noise against output power into 8 and 4 ohms in pentode mode. The combination reaches 1% THD+N at 350Wpc into 8 ohms (25.4dBW) and 580Wpc into 4 ohms (24.6dBW), with the specified 8-ohm power of 380W (25.8dBW) reached at just under 2% THD+N. The distortion remains below 0.1% at powers of less than 15W into 8 ohms and of 25W into 4 ohms. In triode mode, the maximum power was lower, as expected, with the 1% THD+N percentage reached at 88Wpc into 8 ohms (19.5dBW, fig.9) and 170Wpc into 4 ohms (19.3dBW, fig.10). Though respectably low below 1W into either load, the distortion rose linearly with power, due to the somewhat bent transfer function of the V1's triode circuit.
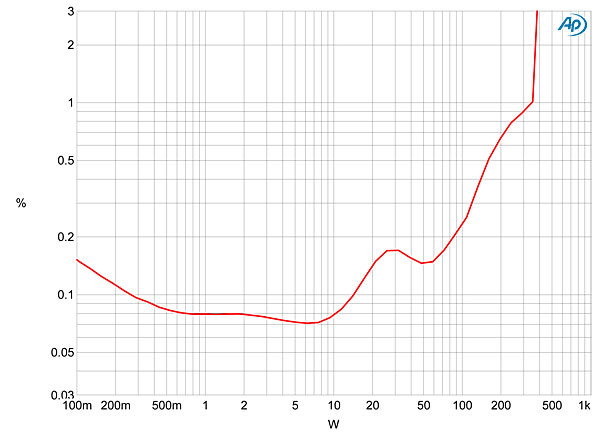
Fig.7 Siltech SAGA, final sample, V1 in pentode mode, distortion (%) vs 1kHz continuous output power into 8 ohms.
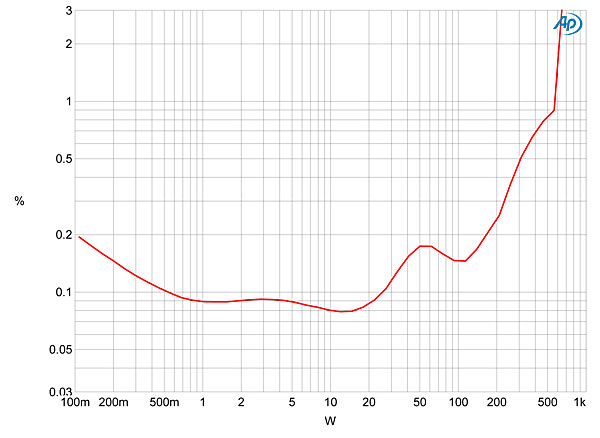
Fig.8 Siltech SAGA, final sample, V1 in pentode mode, distortion (%) vs 1kHz continuous output power into 4 ohms.
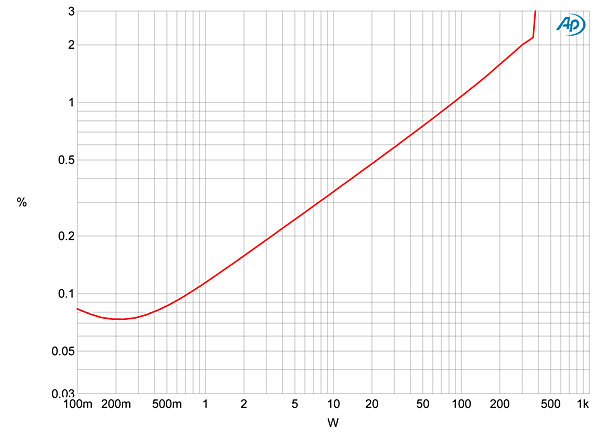
Fig.9 Siltech SAGA, final sample, V1 in triode mode, distortion (%) vs 1kHz continuous output power into 8 ohms.
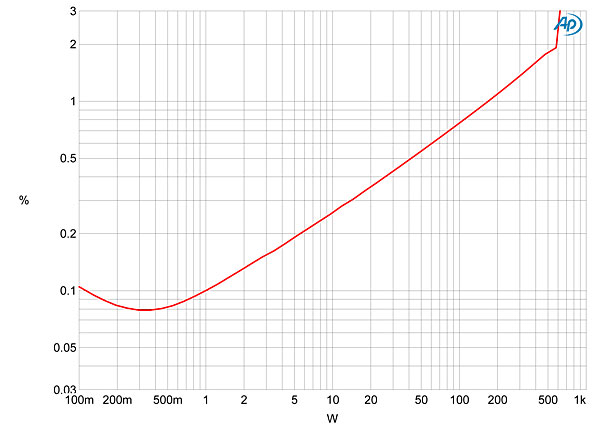
Fig.10 Siltech SAGA, final sample, V1 in triode mode, distortion (%) vs 1kHz continuous output power into 4 ohms.
Fig.11 plots the THD+N percentage against frequency at 11V in pentode mode, which is equivalent to 15W into 8 ohms. The distortion behavior is somewhat different in the two channels, with the left channel (blue and cyan traces) looking more linear than the right (magenta, red), even into 2 ohms (gray). This imbalance appeared to occur in the P1, as the spectrum of the V1's output in pentode mode when outputting 50Hz at 2.83V into 100k ohms (fig.12) revealed identical behavior in the V1's two channels, the only significant distortion harmonic being the second, at –67dB (0.04%). Repeating the analysis at the same output level but with the V1 in triode mode (fig.13) again showed the two channels as identical, but with the second harmonic now at –60dB (0.1%). Looking at the P1's behavior on this test at 15Wpc into 8 ohms (fig.14), the third harmonic is now the dominant distortion component, at –71dB (0.03%), but the even-order harmonics can be seen to be different in the two channels, confirming that it is the P1 in which this linearity imbalance occurs.
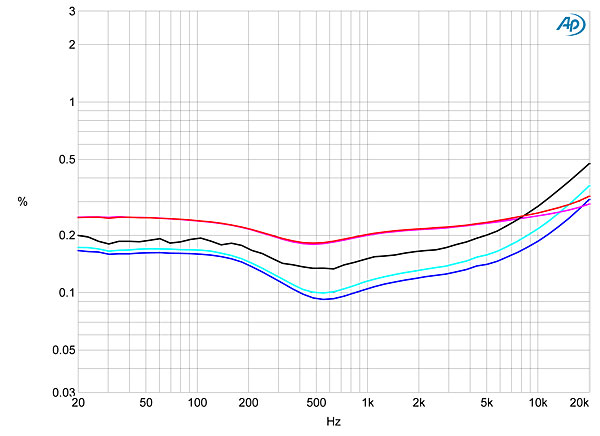
Fig.11 Siltech SAGA, final sample, V1 in pentode mode, THD+N (%)vs frequency at 11V into: 8 ohms (left channel blue, right, red ), 4 ohms (left cyan, red magenta), 2 ohms (gray).
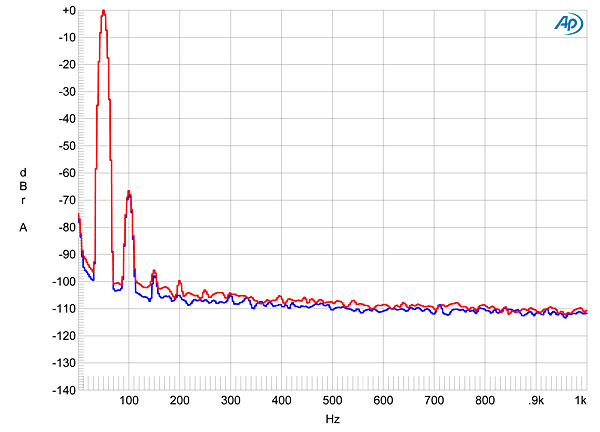
Fig.12 Siltech SAGA, final sample, V1 alone in pentode mode, spectrum of 50Hz sinewave, DC–1kHz, at 2.83V into 100k ohms (linear frequency scale).
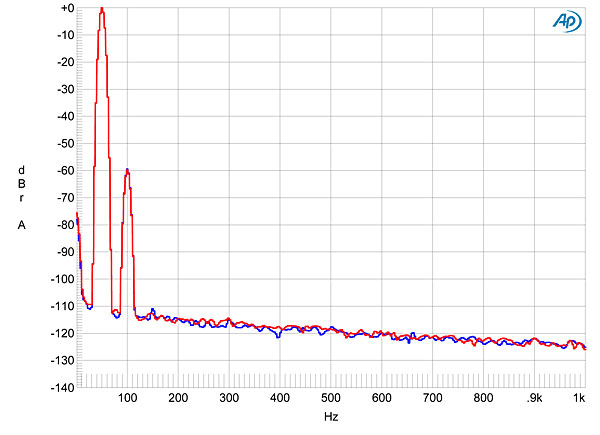
Fig.13 Siltech SAGA, final sample, V1 alone in triode mode, spectrum of 50Hz sinewave, DC–1kHz, at 2.83V into 100k ohms (linear frequency scale).
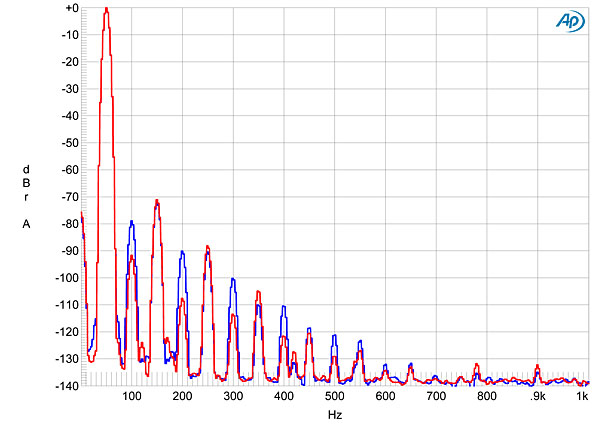
Fig.14 Siltech SAGA, final sample, P1 alone, spectrum of 50Hz sinewave, DC–1kHz, at 15W into 8 ohms (linear frequency scale).
Finally, while the original SAGA's behavior on the high-frequency intermodulation test was very disappointing in both triode and pentode modes, the new sample was very much better. Fig.14 shows the spectrum of the P1's output while it reproduced an equal mix of 19 and 20kHz tones at a peak level of 10W into 8 ohms. All the intermodulation products lie at or below –81dB (0.01%), though the difference tone at 1kHz is higher in the left channel (blue trace) than the right (red).
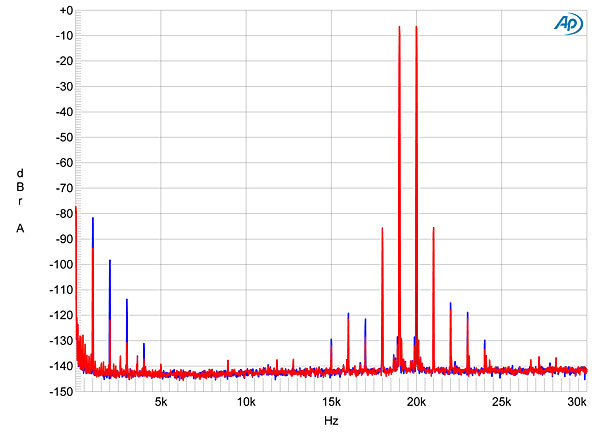
Fig.15 Siltech SAGA, final sample, P1 alone, HF intermodulation spectrum, DC–24kHz, 19+20kHz at 10W peak into 8 ohms (linear frequency scale).
Assuming that these latest samples are representative of current production, the Siltech SAGA's measured performance is still somewhat idiosyncratic. The V1 offers the user the choice between two different distortion signatures, while the P1 offers very high dynamic range, provided the high power is not sustained for very long. All I can say is that this unusual and expensive amplifier must be auditioned with the prospective owner's own speakers to determine if its sonic signature will be optimal.—John Atkinson
|
| ||||||||||
- Log in or register to post comments


| Loudspeakers Amplification Digital Sources | Analog Sources Accessories Featured | Music Columns Retired Columns | Show Reports | Features Latest News Community | Resources Subscriptions |
 © 2024 Stereophile
AVTech Media Americas Inc., USA
All rights reserved

