| Columns Retired Columns & Blogs |
Shahinian Diapason loudspeaker system Measurements
Sidebar 1: Measurements
Figs.1 & 2 show the individual impedance plots for the Diapason satellite and for the Double Eagle subwoofer used on their own; fig.2 shows the impedance magnitude and phase for the complete system. The subwoofer is tuned to a relatively high 48Hz, revealed by the 15.9 ohm peak at that frequency in fig.2. Both satellite and subwoofer have rapidly rising impedances in the crossover region; the net effect can be seen in fig.3, where the combined impedance doesn't drop below 6 ohms below 2kHz. But note the treble region of the satellite in both graphs: The value drops to an amplifier-punishing 1.08 ohms at 17kHz, and is almost all the time below a cruel 2 ohms above 3.6kHz.
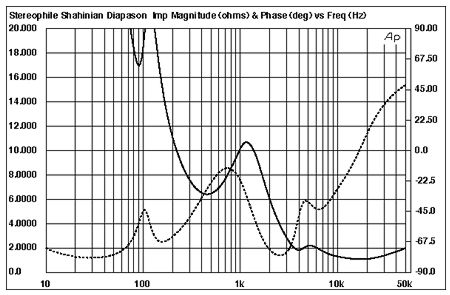
Fig.1 Shahinian Diapason, electrical impedance (solid) and phase (dashed) (2 ohms/vertical div.).

Fig.2 Shahinian Double Eagle, electrical impedance (solid) and phase (dashed) (2 ohms/vertical div.).

Fig.3 Shahinian Diapason & Double Eagle, system electrical impedance (solid) and phase (dashed) (2 ohms/vertical div.).
Note also the severe phase angle between 2.5kHz and 5kHz, a region where the amplitude is 4 ohms or less. This kind of load will mightily stress the output stage of typical class-A/B solid-state amplifiers. To exacerbate things for the partnering amplifier, the Diapason's measured on-axis sensitivity was on the low side, at about 82dB/W/m, which is about the same as the BBC LS3/5A. However, to some extent this will be compensated for by the omnidirectional nature of the speaker's radiation pattern. But the last thing you'd want to do is drive this speaker with any kind of tube amplifier.
Turning to the frequency domain, the rather complicated-looking curves in fig.4 show: the nearfield response of the Double Eagle's rear-facing line-terminating radiator (the ragged-looking green curve that peaks at –16dB at 60Hz); the nearfield response of one of the subwoofer's side-firing drive-units (the red curve that peaks at 60Hz and ends at 1kHz); the nearfield response of the Diapason satellite's midrange units (the blue curve that rolls out sharply below 100Hz); and the quasi-anechoic response on an axis 38" from the ground in front of the speaker and averaged across a 30° horizontal window.
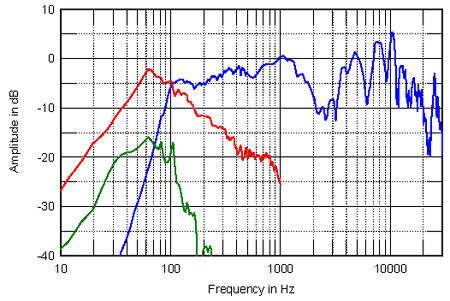
Fig.4 Shahinian Diapason, anechoic response on tweeter axis at 48", averaged across 30° horizontal window and corrected for microphone response, with nearfield midrange (blue), Double Eagle woofer (red), and Double Eagle line termination (green) responses plotted below 200Hz, 800Hz, and 500Hz, respectively.
The first thing to note is that the output of the transmission line basically echoes that from the drive-unit. The line is behaving as a true transmission line and not, as is so often the case, as some kind of perverted reflex port. The subwoofer itself has a bandpass output centered on 60Hz, and, as plotted here (which reflects the in-room balance that I obtained, see later), is a little too sensitive to be a good match with the satellite, which itself extends down to 90Hz. But putting aside the possible bass-integration problems, the main things noticeable in this graph are the deep suckout between 1600Hz and 3kHz and the peaky, ragged nature of the mid-treble. At least to judge from fig.4, the Diapason is not a flat speaker. And the curves in fig.4 neatly correlate with J. Gordon Holt's listening impressions.
"But," I can almost hear Richard Shahinian spluttering, "the Diapason is an omnidirectional design and it is inappropriate to represent its performance response by just looking at the 'on-axis' response." Good point, Richard. I therefore measured the anechoic response on this axis every 15° in a complete circle around the Diapason. The individual responses can be seen in fig.5, the averaged result in fig.6. The spatial averaging has smoothed much of the measured position-dependent peakiness in the top two octaves, but the trough in the upper midrange/low treble remains. Thinking that there might be some axes where things looked better, I looked at different averaged responses—front 180° window, rear 180° window, side 30° window—but none of these appeared appreciably different from fig.6.

Fig.5 Shahinian Diapason, lateral response family at 48", normalized to response on tweeter axis, from back to front: differences in response 180°–5° to the side; reference response; differences in response 5°–180° to the side.

Fig.6 Shahinian Diapason & Double Eagle, anechoic response on tweeter axis at 48", averaged across 360° horizontal window and corrected for microphone response, with complex sum of nearfield woofer and port responses plotted below 300Hz.
Fig.7 shows the changes in response to be expected in the vertical plane, assuming a perfectly flat on-axis response. The pattern of high treble peaks and dips changes considerably as the listener moves up and down in front of the speaker, but there is no axis where the low-treble trough fills in.
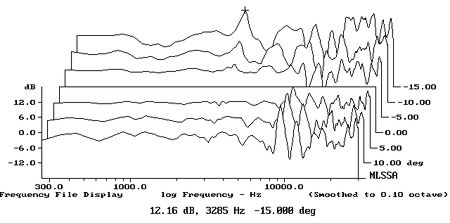
Fig.7 Shahinian Diapason, vertical response family at 48", normalized to response on tweeter axis, from back to front: differences in response 15°–5° above tweeter axis; reference response; differences in response 5°–15° below tweeter axis.
It's still fair to point out that with an omnidirectional design, the proof, listening aside, is how the thing works in the listening room. To show how these quasi-anechoic measurements added up in my listening room, I used an Audio Control Industrial SA-3050A 1/3-octave spectrum analyzer with its own microphone to take 20 1/3-octave spectral responses of left and right speakers individually across a 72" by 20" window centered on the listening seat. Averaging these spectra with a slight weighting toward the listening position has proven to give quite good correlation with the subjective balance in my room. The result can be seen in fig.8. The big peak in the 63Hz band is due to the subwoofer's tuning coinciding with a room mode that failed to be minimized by the spatial averaging. Here, again, is that low-treble trough, followed by a mid-treble plateau. This is what Gordon heard; this as you will have read above, is what I heard.

Fig.8 Shahinian Diapason & Double Eagle, spatially averaged, 1/3-octave response in JA's room.
Given the smooth nature of the Diapason's in-room balance and the fact that the speaker's impedance is around an ohm throughout the top two octaves, it's possible that using an amplifier with a high output impedance would knock down that treble peak, resulting in an over-warm but now pleasing balance. I suspect that this is why Gordon's substitution of the Bedini for the Boulder amplifier reduced the speaker's tizziness. Fig.9 shows the effect on the Diapason's in-room balance if the Mark Levinsons that I used, or Gordon's Boulder 500, were replaced by a classic tube amp. The top trace is the same as fig.7; the lower trace is calculated from the impedance values in fig.3, assuming an amplifier output impedance of 1 ohm. The top two octaves of treble are suitably hinged down, by up to 5.6dB, though the energy deficit in the low treble remains.

Fig.9 Shahinian Diapason & Double Eagle, spatially averaged, 1/3-octave response in JA's room driven by Mark Levinson No.20.6 (blue) and when modified by simulated 1 ohm amplifier output impedance (red). Note reduction in mid-treble level by 5.6dB.
The real problem with this approach, however, is that any real-world amplifier with a suitably high source impedance to tame the Diapason treble would not be able to deliver sufficient current into a 1 ohm load to play any louder than quite quiet. There is the possibility that the manufacturer could experiment with various low-value series resistors in the Diapason's tweeter feeds, which would both raise the speaker's impedance to a more practicable value and reduce the mid-treble peak, though this would also depress the top half-octave to the point where the speaker's sound would lack sufficient air.
Finally, fig.10 shows the Diapason's impulse response on the 38"-high "listening axis"; note what appear to be multiple arrivals from the various drive-units, while fig.11 shows the cumulative spectral-decay or "waterfall" plot computed from this impulse response. Despite the unflat nature of the speaker's low treble and midrange, the die-away of its sound is actually commendably clean. A resonant mode can be seen at the cursor position, 1240Hz, but this is minor. As well as being peaky, the high treble is hashy, probably due to interference between the various drive-units rather than to resonances per se.—John Atkinson

Fig.10 Shahinian Diapason, impulse response on tweeter axis at 48" (5ms time window, 30kHz bandwidth).
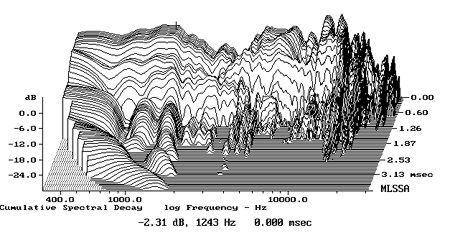
Fig.11 Shahinian Diapason, cumulative spectral-decay plot at 48" (0.15ms risetime).
NEXT: Specifications »
|
| ||||||||||
- Log in or register to post comments


| Loudspeakers Amplification Digital Sources | Analog Sources Accessories Featured | Music Columns Retired Columns | Show Reports | Features Latest News Community | Resources Subscriptions |
 © 2024 Stereophile
AVTech Media Americas Inc., USA
All rights reserved

