| Columns Retired Columns & Blogs |
Scientific Fidelity Tesla loudspeaker Measurements
Sidebar 1: Measurements
Footnote 1: See Martin Colloms's "Basso Profundo" article last December, Vol.14 No.12, pp.107 & 108.—John Atkinson
There were no surprises in the Tesla's plot of electrical impedance magnitude and phase (fig.1). The shape of the curve in the bass implies that the rear port is tuned to a low 22Hz, revealed by the dip in magnitude at that frequency. (I left the foam plug in place for all the measurements, though I did remove the grille socks.) The impedance drop to 5 ohms at 90Hz should not present good amplifiers with any drive problems, though as a great deal of high-power musical information lies in this upper-bass region, this impedance dip will also lead to a more limited than expected dynamic range when the Tesla is powered by Scientific Fidelity's own Trillium amplifier.

Fig.1 Scientific Fidelity Tesla, electrical impedance (solid) and phase (dashed) wth foam in port. (2 ohms/vertical div.)
The wrinkle in the traces at 26kHz is due to the tweeter's fundamental "oil-can" resonance, below which its diaphragm behaves in good pistonic manner. A trace of a wrinkle can also be seen in the phase plot between 200 and 300Hz. Examining the impedance below 1kHz in a more detailed manner (not shown) reveals slight wrinkles in the curves at approximately 240Hz and 680Hz, indicating the possible presence of slight cabinet resonant problems at these frequencies. Certainly the cabinet sidewalls seem very live between 210Hz and 270Hz.
For the frequency-response measurements, I drove the speaker with a Krell KSA-250. Fig.2 shows the Tesla's impulse response on the tweeter axis, fig.3 the step response, both as calculated by the DRA Labs MLSSA system. (This axis is 39" from the ground, which represents a slightly high listening seat.) The relatively slow decay hump is due to the highish-order crossover filters, overlaid with inaudible ringing from the tweeter's ultrasonic resonance. All three drive-units are conencted in the same positive acoustic polarity.
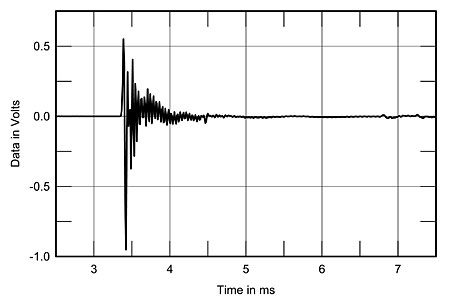
Fig.2 Scientific Fidelity Tesla, impulse response on tweeter axis at 44" (5ms time window, 30kHz bandwidth).
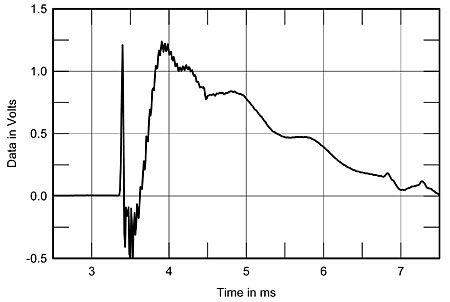
Fig.3 Scientific Fidelity Tesla, step response on tweeter axis at 44" (5ms time window, 30kHz bandwidth).
Taking five such impulse responses across a 30° horizontal arc in front of the speaker on the tweeter axis, transforming the reflection-free portions to the frequency domain and averaging, gives the quasi-anechoic amplitude response shown to the right of fig.4. (This curve has had the microphone's own deviation from an on-axis flat response subtracted.) A rising trend above 3kHz is noticeable, leading to the tweeter's ultrasonic resonance at 25.5kHz, with a notch just below that frequency presumably due to the protective plate in front of the driver's diaphragm. In itself, this response trend will not make the speaker sound "bright," instead leading to a tonal balance that will sound "airy," spacious, and detailed. However, it will be unkind to record surface noise and recorded tape hiss, in that it will exaggerate their audibility.

Fig.4 Scientific Fidelity Tesla, anechoic response on tweeter axis at 44", averaged across 30° horizontal window and corrected for microphone response, with the nearfield responses of the port and woofer and their complex sum plotted below 300Hz, 1kHz and 300Hz, respectively.
Note, however, the peaky behavior between 800Hz and 3kHz. This is near the region where the ear is most sensitive; all things being equal, I would expect this kind of amplitude response shape to indicate that the speaker does sound rather bright.
To the left of fig.4 are shown the nearfield responses of the woofers and foam-filled port, taken with the microphone as close as possible to the diaphragm and port opening center, respectively, and again with the speaker driven by the Krell. The level matching between these two curves and the quasi-anechoic curve can only be approximate. Note, however, the slightly peaky nature of the woofer's output between 50Hz and 90Hz. This, combined with the fact that the port and woofer outputs are out of phase below 30Hz or so, might correlate with the speaker's tendency to sound rather boomy in the bass. The estimated bass extension, relative to the maximum level, is a quite high 50Hz, –3dB, which—in conjunction with the ported bass loading (footnote 1)—would explain why real low-bass sounds were missing in action, as CG noted.
The room reverberant soundfield also has a major influence on any loudspeaker's perceived tonal balance. To examine this aspect of the Tesla's performance, I took impulse responses at angles of 30°, 45°, 60°, and 90° off its tweeter axis. Again transforming the reflection-free sections of these impulses to the frequency domain, but this time subtracting the speaker's response on the tweeter axis, gives the family of curves in fig.5, which shows the difference in response to be expected as the listener moves 'round to the speaker's side. The high treble can be seen to roll off more than 30° off-axis; perhaps more importantly, the ubiquitous 2.8kHz peak that appears off-axis exactly fills in the notch at that frequency in the forward response (fig.4), while the speaker's output in the low treble only droops slightly all the way 'round to 60° off-axis.
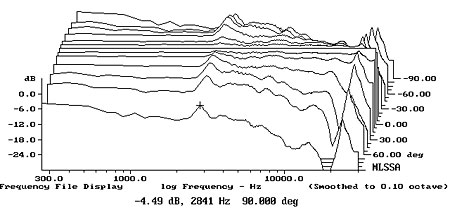
Fig.5 Scientific Fidelity Tesla, lateral response family at 44", normalized to response on tweeter axis, from back to front: differences in response 90–15° off-axis, reference response, differences in response 15–90° off-axis.
Fig.6, for example, shows the actual response 60° off the tweeter axis. The room reverberant soundfield will therefore have too much energy in the low treble region, as will the reflections of the speaker's sound from the side-walls. Again, this will tend to make the Teslas sound bright in all but very highly damped rooms.
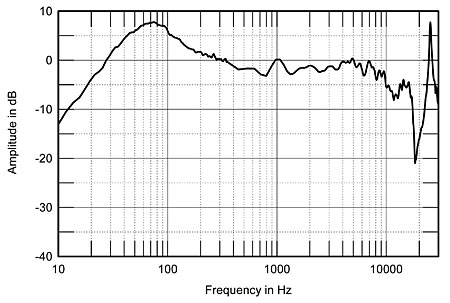
Fig.6 Scientific Fidelity Tesla, anechoic response 60° to the side of the tweeter axis at 44", corrected for microphone response, with the complex sum of the nearfield port and woofer responses plotted below 300Hz.
Carrying out the same exercise but in the vertical plane gives an indication of how the speaker's tonal balance will change as the listener sits with his or her ears at different heights. Again, fig.7 shows the differences in the speaker's response. The most forward curve reveals that very little change is introduced by sitting on the lower woofer axis—a more reasonable listener axis, in my opinion. Moving higher and higher above the tweeter, however, gives more and more change in the speaker's low-treble balance. Comparing this family of curves with fig.4 indicates that the flattest response is to be obtained when listening to the Tesla with your ears level with the cabinet top, a position typical of a kitchen or similarly tall chair.
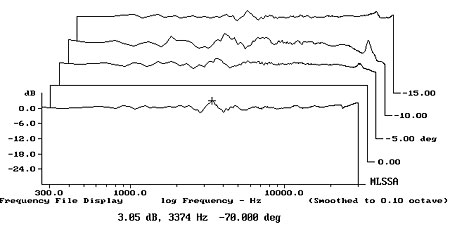
Fig.7 Scientific Fidelity Tesla, vertical response family at 44", normalized to response on tweeter axis, from back to front: differences in response 15–5° above axis, reference response, difference in response 5° below axis.
Fig.8 is the Tesla's calculated cumulative spectral-decay, or "waterfall," plot. It shows how the speaker's frequency response changes as the sound of the impulse dies away. If there are any resonances, these show up as ridges parallel to the time axis, corresponding to ringing at these frequencies. The tweeter's ultrasonic resonance is very obvious in fig.8, but more importantly, note the ridge centered on 1065Hz. This indicates that the peak at this frequency in fig.4 is not a crossover artifact but is due to some kind of resonant behavior, which will add to the feeling of brightness. (Ignore the minor ridge at 16kHz, which is due to spurious pickup of the computer monitor's line-scan frequency.) Without access to the individual drivers, however, it is impossible to say whether this behavior is due to the tweeter's not being rolled-off sufficiently at its fundamental resonant frequency, or to a strong break-up mode in the woofer cones.
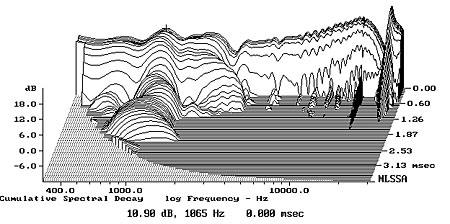
Fig.8 Scientific Fidelity Tesla, cumulative spectral-decay plot at 44" (0.15ms risetime).
Note also that the on-axis dip at 2.8kHz at time zero is followed by a wave of energy at that frequency around 0.7ms, indicating that it is some kind of interference phenomenon and confirming the evidence from figs.5 and 6 that it will not be apparent on axes other than that dead ahead of the speaker. The owner of a pair of Teslas should therefore experiment with toe-in to get the smoothest treble.
This set of measurements reminds me of the Avalon Acoustics Eclipse loudspeaker that I reviewed in January 1991 (Vol.14 No.1), another two-way speaker whose designer has chosen an unnaturally low crossover frequency. It would seem that taking the tweeter an octave or more lower than usual generally results in a bright tonal balance, due in part to the tweeter's almost hemispherical radiation pattern in the low treble. This is coupled with compromised dynamics due to the driver's restricted diaphragm movement in this same region. Yet, perhaps also due to the wide dispersion and a balance that is bright (and in the case of the Tesla, tilted-up with frequency), the sound will be superbly detailed and delightfully tangible, coupled with superbly precise stereo imaging.
This kind of tonal balance seems to make a speaker's musical acceptablity critically dependent on the amplifier used to drive it. I found the Avalon Eclipse to sound unlistenably hard and bright with good solid-state amplification; it needed tubes to sound acceptable. Partly for convenience but mainly to get an absolute idea of the Telsa's performance, all my measurements were taken with a typical solid-state amplifier. CG, however, indicated that the sound of the Tesla varied a great deal with the amplifier used. He preferred the sound with Scientific Fidelity's own Trillium tube design, doing his auditioning with that amplifier from its 8 ohm output transformer tap. (The Trillium has a very high measured output impedance—3 ohms at 1kHz—from its 8 ohm tap, this dropping to 1 ohm from the 4 ohm tap.)
The top curve in fig.9 shows the Trillium's response at 1W into an 8 ohm resistive load. Rising gently from –0.15dB at 10Hz to a maximum at 3.5kHz, it rolls off to –0.5dB at 20kHz. But look at the roller-coaster curve in fig.8, which shows the voltage drive at the Tesla terminals when hooked up to the Trillium's 8 ohm output tap. This curve roughly follows the shape of the Tesla's impedance magnitude curve (fig.1) and is due to the voltage-divider interaction between the amplifier's output impedance and the impedance of the loudspeaker. You can see that the bass gets lumpier with the tube amp, as noted by CG. Note also that the Trillium does significantly roll off the speaker's highs, the response being some 2dB down at 20kHz.—John Atkinson
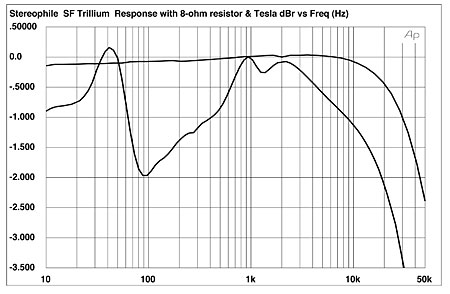
Fig.9 Scientific Fidelity Trillium, frequency response when driving (from top to bottom at 10kHz) 8 ohm resistor, Scientific Fidelity Tesla (0.5dB/vertical div.).
Footnote 1: See Martin Colloms's "Basso Profundo" article last December, Vol.14 No.12, pp.107 & 108.—John Atkinson
NEXT: Specifications »
|
| ||||||||||
- Log in or register to post comments


| Loudspeakers Amplification Digital Sources | Analog Sources Accessories Featured | Music Columns Retired Columns | Show Reports | Features Latest News Community | Resources Subscriptions |
 © 2024 Stereophile
AVTech Media Americas Inc., USA
All rights reserved

