| Columns Retired Columns & Blogs |
This has got to be one of the coolest looking pieces of audio equip.
I used Stereophile's loan sample of the Audio Precision SYS2722 system to measure the Resolution Audio Cantata (see www.ap.com and the January 2008 "As We See It"); for some tests, I also used my vintage Audio Precision System One Dual Domain and the Miller Audio Research Jitter Analyzer. As well as driving the Cantata with S/PDIF data from the Audio Precision analyzers, I used a MacBook running Mac OS10.6.8 and Pure Music 1.8 to play test-signal files via USB.
The Macintosh USB Prober utility identified the device as the "Cantata Music Center" from "Resolution Audio." It also reported that the Cantata's USB input operated in the jitter-rejecting asynchronous mode with 24-bit resolution and data sampled at 44.1, 48, 88.2, and 96kHz (footnote 1). The maximum output level at 1kHz was 5.53V balanced and 2.57V unbalanced. (The latter is 2.2dB higher than the CD standard's 2V RMS.) Both sets of outputs preserved absolute polarity (ie, were non-inverting). The XLR jacks are wired with pin 2 hot. The volume control operated in accurate 0.5dB steps; ie, a setting of "88" was equivalent to –6dB. The output impedance was to specification from the unbalanced jacks, at 100 ohms, but half that figure from the balanced XLRs, which is unusual; typically, the balanced output impedance is twice that of the unbalanced output.
Tested as a CD player with the Pierre Verany Test CD, which has laser-cut gaps in its data spiral, the Cantata had the best error correction/concealment I have encountered, there being no audible glitches in the reconstructed audio even when the gaps reached 4mm in length!
The Cantata's frequency response followed the same basic shape regardless of sample rate (fig.1), the only difference between the outputs at 192kHz (blue and red traces), 96kHz (cyan and magenta traces), and 44.1kHz (green and gray traces) being the sharp falloff just below half the sample rate. Channel separation (not shown) was superb at >110dB in both directions below 1kHz, though this decreased to 85dB at 20kHz due to the usual capacitive coupling between the two channels' circuits.
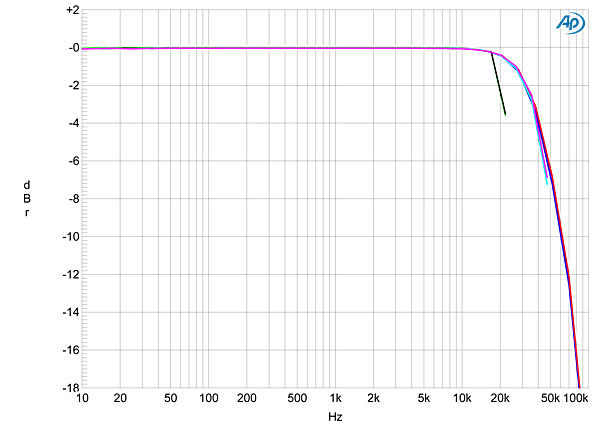
Fig.1 Resolution Cantata, frequency response at –12dBFS into 100k ohms with data sampled at: 44.1kHz (left channel green, right gray), 96kHz (left cyan, right magenta), 192kHz (left blue, right red). (0.25dB/vertical div.)
My primary test for assessing a digital product's resolution is to sweep a 1/3-octave bandpass filter from 20kHz to 20Hz while it decodes dithered data representing a 1kHz tone at –90dBFS. The top pair of traces in fig.2 were taken with 16-bit data; while no distortion products can be seen, and the spectrum above 1kHz is dominated by the dither noise, the midrange output is marred by the presence of power-supply–related spuriae at 120Hz and its harmonics. While these spuriae are still low in absolute terms, I'd rather they weren't there at all. Increasing the bit depth to 24 drops the higher-frequency noise floor by 9dB or so (fig.2, middle pair of traces), which suggests the Cantata's ultimate resolution is not much better than 17.5 bits or so, and again the supply-related spuriae can be seen. When I tested the Cantata for linearity with 16-bit data (fig.3), there was little linearity error down to below –100dBFS, though with 24-bit data, a tone at –120dBFS was reproduced as –116dBFS (fig.2, bottom traces).

Fig.2 Resolution Cantata, 1/3-octave spectrum with noise and spuriae of dithered 1kHz tone at –90dBFS, with: 16-bit data (top), 24-bit data (middle), dithered 1kHz tone at –120dBFS with 24-bit data (bottom). (Right channel dashed.)
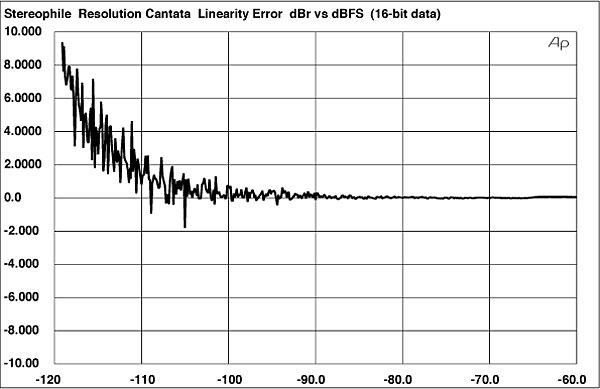
Fig.3 Resolution Cantata, linearity error, 16-bit data (2dB/vertical div., dBr vs dBFS).
Fig.4 repeats the spectral analysis for the –90dBFS tone using an FFT technique. Again, the increase in bit depth drops the noise floor by around 10dB, but now the 24-bit tone can be seen to be accompanied by some very low-level harmonic spuriae. Perhaps there are some slight mathematical limitations in the Cantata's DSP engine? With some other D/A processors, I have noticed that there is some modulation of the noise floor with signal level. Fig.5 shows the low-frequency spectrum of the Cantata's output while it reproduced a 1kHz tone at 0dBS (blue and red traces), –40dBFS (cyan and magenta traces), and –60dBFS (green and gray traces). Commendably, the noise floor hardly changes with the change in signal level, though it is about 10dB higher than with the very best D/A processors I have measured, and the low-level supply-related spuriae are evident. This graph was taken from the balanced outputs; the picture remained the same from the unbalanced outputs.

Fig.4 Resolution Cantata, FFT-derived spectrum with noise and spuriae of dithered 1kHz tone at –90dBFS, with: 16-bit data (left channel cyan, right magenta), 24-bit data (left blue, right red).
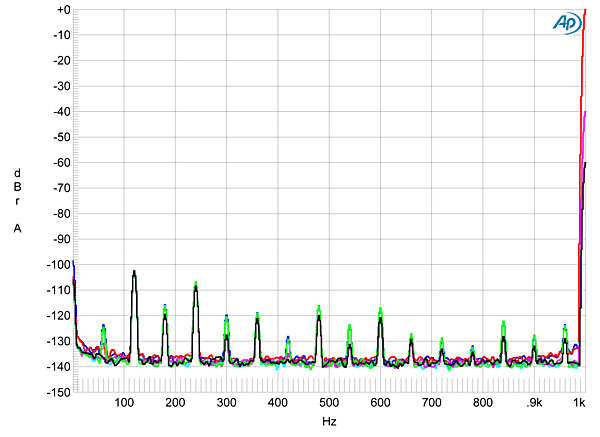
Fig.5 Resolution Cantata, spectrum of 1kHz sinewave, DC–1kHz, at 0dBFS (left channel blue, right red), –40dBFS (left cyan, right magenta), –60dBFS (left blue, right red). (Linear frequency scale.)
The Cantata's noise floor is still sufficiently low to allow to be depicted the three DC voltage levels that describe an undithered 16-bit tone at exactly –90.31dBFS (fig.6), and its resolution is good enough for undithered 24-bit data to produce a good facsimile of a sinewave at the same level (fig.7).
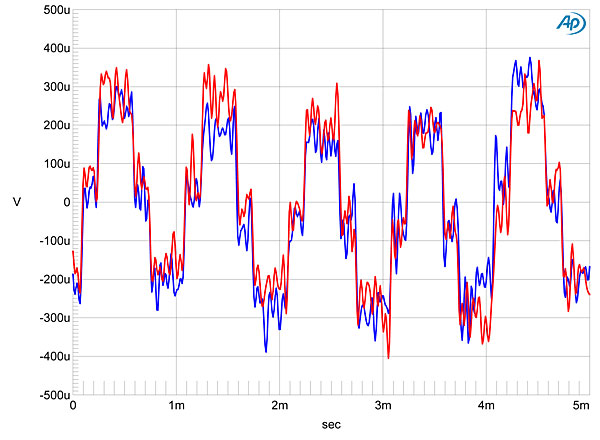
Fig.6 Resolution Cantata, waveform of undithered 1kHz sinewave at –90.31dBFS, 16-bit data (left channel blue, right red).
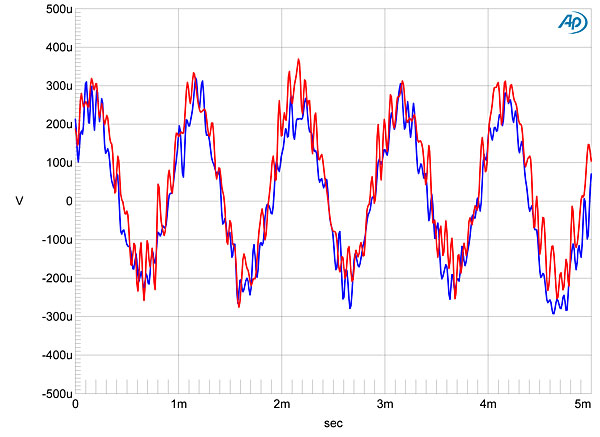
Fig.7 Resolution Cantata, waveform of undithered 1kHz sinewave at –90.31dBFS, 16-bit data (left channel blue, right red).
FFT spectral analysis of the Cantata's output while it reproduced a full-scale 50Hz tone into 100k ohms (fig.8) indicated that the harmonic-distortion components are generally lower in level than the supply-related components at 120 and 240Hz, the exception being the fifth harmonic, at 250Hz, which is at the same level. Repeating the analysis with a 1kHz tone (fig.9) confirms that the fifth harmonic is the highest in level, though this differs in the two channels, lying at –116dB (0.00015%) in the right channel and –107dB (0.0004%) in the left. All other harmonics lie at or below –110dB (0.0003%), so this low-level lack of linearity might well be subjectively harmless. Nor did it change when the 100k ohm laboratory load was replaced by the punishing 600 ohm load. To put these test results into perspective, however, the best-sounding D/A processors offer no high-order harmonic distortion products at all. Intermodulation distortion was superbly low in level (fig.10).

Fig.8 Resolution Cantata, spectrum of 50Hz sinewave, DC–1kHz, at 0dBFS into 100k ohms (left channel blue, right red; linear frequency scale).
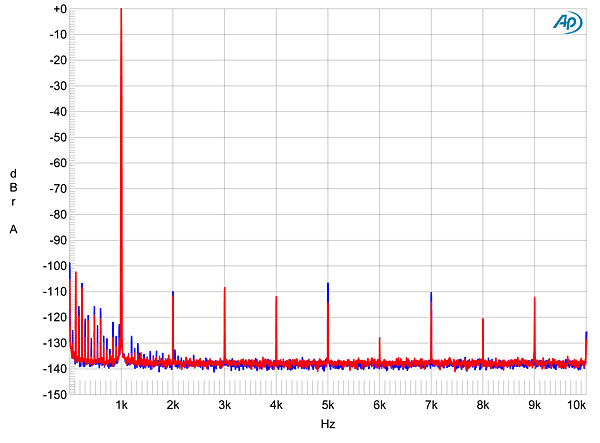
Fig.9 Resolution Cantata, spectrum of 1kHz sinewave, DC–10kHz, at 0dBFS into 100k ohms (left channel blue, right red; linear frequency scale).
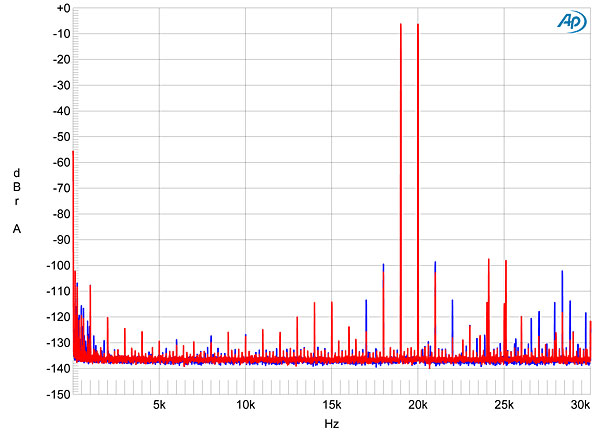
Fig.10 Resolution Cantata, HF intermodulation spectrum, DC–30kHz, 19+20kHz at 0dBFS into 100k ohms (left channel blue, right red; linear frequency scale).
Fig.11 shows the Cantata's rejection of jitter when fed J-Test data via its TosLink input with 16-bit (cyan and magenta traces) and 24-bit data (blue and red traces). With the exception of a single pair of sidebands at ±229Hz, which the Miller Analyzer estimated as being equivalent to 120 picoseconds in the left channel and 82ps in the right, the odd-order harmonics of the Fs/192 tone are at the residual level in the 16-bit traces. However, the single pair of sidebands remains at that level with the 24-bit version of the J-Test; as they shouldn't be present at all with 24-bit data, this suggests that these sidebands are due not to interface jitter but to some other mechanism. With the Cantata fed the same 16- and 24-bit J-Test data via USB (fig.12), the traces are free from all jitter-related artifacts: evidence for the efficacy of the Cantata's asynchronous USB receiver. Although I didn't test it, the Cantata's Ethernet input should similarly be jitter-free. With CD data (fig.13), the jitter was below the resolution limit of the Miller Analyzer.
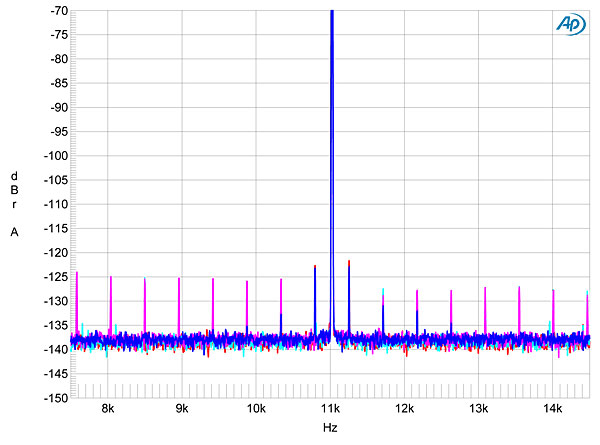
Fig.11 Resolution Cantata, high-resolution jitter spectrum of analog output signal, 11.025kHz at –6dBFS, sampled at 44.1kHz with LSB toggled at 229Hz: 16-bit data via 15' TosLink S/PDIF from AP SYS2722 (left channel cyan, right magenta), 24-bit data (left blue, right red). Center frequency of trace, 11.025kHz; frequency range, ±3.5kHz.
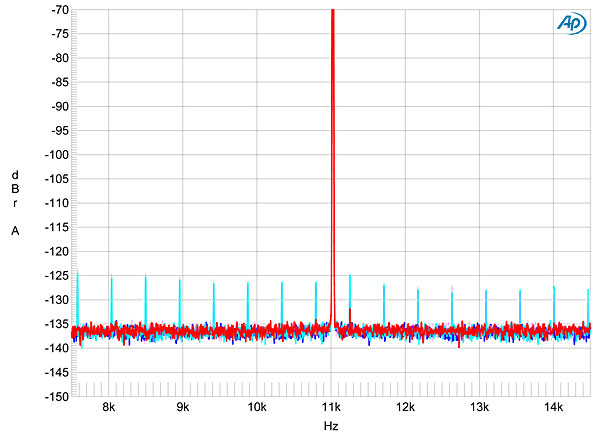
Fig.12 Resolution Cantata, high-resolution jitter spectrum of analog output signal, 11.025kHz at –6dBFS, sampled at 44.1kHz with LSB toggled at 229Hz: 16-bit data via USB from MacBook (left channel cyan, right magenta), 24-bit data via USB (left channel blue, right red). Center frequency of trace, 11.025kHz; frequency range, ±3.5kHz.
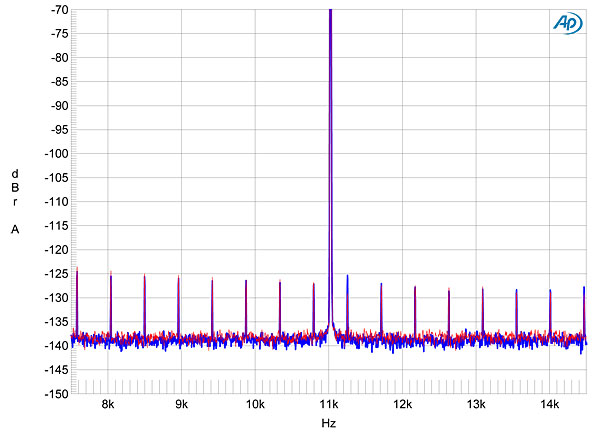
Fig.13 Resolution Cantata, high-resolution jitter spectrum of analog output signal, 11.025kHz at –6dBFS, sampled at 44.1kHz with LSB toggled at 229Hz: 16-bit data from CD (left channel cyan, right magenta), 24-bit data via USB (left channel blue, right red). Center frequency of trace, 11.025kHz; frequency range, ±3.5kHz.
The Resolution Audio Cantata's low-level performance is not quite up to the state of the art. But it is otherwise a well-engineered product, with superb rejection of jitter in all performance modes and the best error correction I have encountered in a CD player. It is also drop-dead gorgeous!—John Atkinson
|
|
| ||||||||||

This has got to be one of the coolest looking pieces of audio equip.

Rarer than one would think in high-end HiFi... a simply lovely box.
Happy Listening!

Which disc-drive did they built in the Cantata? It looks like a slot-in drive from a notebook...


| Loudspeakers Amplification Digital Sources | Analog Sources Accessories Featured | Music Columns Retired Columns | Show Reports | Features Latest News Community | Resources Subscriptions |
 © 2024 Stereophile


