| Columns Retired Columns & Blogs |
Can one correlate intersample overs to the square wave phenomenon JA is referring to here? That is, Philips, Wadia, Pioneer's Legato Linear, and Meitner do not "compress" the overs?
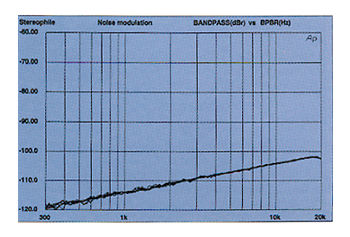
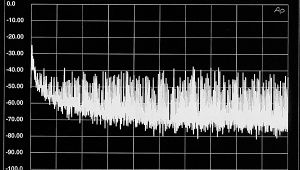
Fig.11 Excellent CD player, noise modulation, -60 to -100dBFS (10dB/vertical div.).
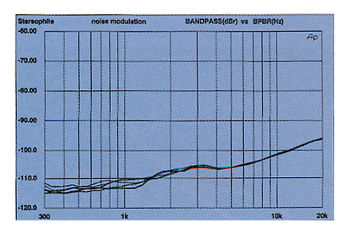
Fig.12 Average CD player, noise modulation, -60 to -100dBFS (10dB/vertical div.).
Intermodulation
Another test in which there may be a reasonably strong correlation with perceived sound quality is the FFT-derived spectral analysis of the processor's output when decoding data representing a full-scale mix of 19kHz and 20kHz tones. The waveform of this signal is shown in fig.13: each signal component has an amplitude of -6dBFS; their combination reaches 0dBFS. This reveals intermodulation components, such as the 1kHz difference tone (20kHz minus 19kHz), and interactions between the sampling frequency (44.1kHz) and the test signals. Processors or players with poor analog output stages will also do badly on this test.
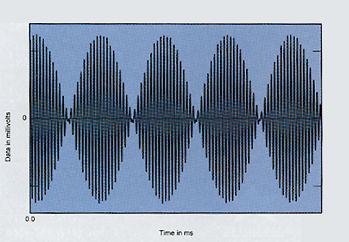
Fig.13 Waveform of signal consisting of two equal-amplitude sinewaves with frequencies of 19kHz and 20kHz. The peak amplitude is twice that of either tone alone.
As with the spectral analysis we saw earlier of the -90dB, 1kHz sinewave, this spectral analysis also plots energy against frequency. But this technique does it a little differently. In an FFT-derived spectral analysis, the processor's output is captured in the time domain as a waveform, and transformed into the frequency domain using the Fast Fourier Transform (FFT) mathematical algorithm (footnote 6).
The result of this technique is shown in fig.14, the FFT-derived spectrum of a typically good processor's output when decoding this demanding test signal. The 1kHz difference component is apparent at -90dB, and 1kHz-spaced sidebands on either side of the test signal can be seen. Ideally, there should be no spikes in the noise floor. The higher the spikes' amplitude, and the greater their number, the worse the intermodulation performance. There appears to be some correlation between a lack of intermodulation products and a lack of glare and hard textures. 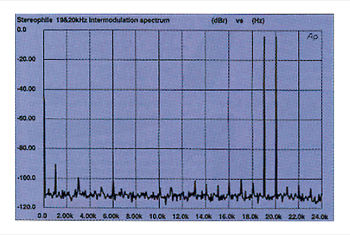
Fig.14 Excellent CD player, HF intermodulation spectrum, DC-22kHz, 19+20kHz at 0dBFS (linear frequency scale, 20dB/vertical div.).
|
| |||||||||

Can one correlate intersample overs to the square wave phenomenon JA is referring to here? That is, Philips, Wadia, Pioneer's Legato Linear, and Meitner do not "compress" the overs?


| Loudspeakers Amplification Digital Sources | Analog Sources Accessories Featured | Music Columns Retired Columns | Show Reports | Features Latest News Community | Resources Subscriptions |
 © 2024 Stereophile