| Columns Retired Columns & Blogs |
PSB Platinum T8 loudspeaker Measurements
Sidebar 3: Measurements
Footnote 1: I welcome the manufacturers of loudspeakers reviewed in Stereophile sending me their own measurements. Not only does it provide me with a check on my measurements, it helps very much for me to see what the designer has tried to achieve in terms of response flatness and dispersion.—John Atkinson
My estimate of the Platinum T8's voltage sensitivity was a little lower than specified, at 87dB(B)/2.83V/m, though this will be partly due to my use of a B-weighted figure, which reduces the effect of a speaker's extension at both frequency extremes. However, the speaker's impedance (fig.1) was exactly to specification, at 4 ohms nominal and minimum. The traces in this graph diverge above 500Hz, one set being taken with the rear tweeter jumper in place, the other without. Without the rear tweeter in-circuit, the impedance steadily rises above 2kHz; with it, the impedance drops to 4.5 ohms or so in the high treble. But in either condition, the always-low electrical phase angle means that the Platinum T8 is not going to present drive problems to a good amplifier rated at 4 ohms.
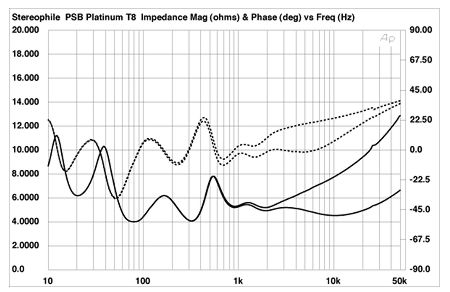
Fig.1 PSB Platinum T8, electrical impedance (solid) and phase (dashed) with rear tweeter off (top traces above 500Hz) and on (bottom traces). (2 ohms/vertical div.)
Other than a small wrinkle at 26kHz, which indicates the main resonant mode of the aluminum-dome tweeters, the traces in fig.1 are free from the glitches that would imply the presence of major cabinet resonances. Examining the vibrational behavior of the T8's panels with an accelerometer confirmed their low resonant signature. Fig.2 is a cumulative spectral-decay plot calculated from the accelerometer's output when it was fastened to the speaker's side wall about 12" from the aluminum top plate. Yes, four resonant modes can be seen between 200Hz and 500Hz, but they are well down in level.

Fig.2 PSB Platinum T8, cumulative spectral-decay plot calculated from the output of an accelerometer fastened to the cabinet's side panel 12" from top. (MLS driving voltage to speaker, 7.55V; measurement bandwidth, 2kHz.)
The saddle between 20Hz and 25Hz in the impedance magnitude trace (fig.1) suggests that the rectangular port at the base of the speaker's front baffle is tuned to a very low frequency. This is confirmed by the nearfield traces shown in fig.3: the port's output is the low-level bandpass curve, peaking slightly in the low-bass region and roughly coinciding with the notch in the output of the woofers around 18Hz. (All three woofers appear to have the same output.) The port probably does more to relieve the excursion requirements of the woofers than to add much in the way of extension. That the port apparently has no obvious upper-frequency resonant modes, by the way, pays tribute to the designer's skill. Placing a port at the end of a rectangular pipe—a tower speaker—can be an invitation to unwanted resonant behavior.
To the right of fig.3 is shown the output of the midrange units, these rolling off below 400Hz rather than the specified 500Hz. These traces were measured in the nearfield and weighted according to the relative ratios of the square roots of the diaphragms' radiating areas; I repeated the measurements in the farfield, which also suggested a crossover point closer to 400Hz. However, the difference is not really significant.

Fig.3 PSB Platinum T8, nearfield responses of the midrange units, woofers, and port plotted below 800Hz, 1kHz, and 600Hz, respectively.
Fig.4 shows the Platinum T8's output averaged across a 30 degrees horizontal window on the tweeter axis. The speaker's response is extraordinarily flat throughout the midrange and treble. Reassuringly, it is effectively identical to the response (not shown) measured by Paul Barton in the Canadian NRC's large anechoic chamber in Ottawa, even down to the fine detail such as the small notch at 4kHz (footnote 1). This notch is specific to the tweeter axis; it fills in immediately above and below (see below). The peak at the tweeter's ultrasonic resonant frequency is moderate, as these things go. It will be benign, particularly with band-limited CD program material, where it will not be excited, even by transients.

Fig.4 PSB Platinum T8, anechoic response on tweeter axis at 50", averaged across 30 degrees horizontal window and corrected for microphone response, with the complex sum of the nearfield responses plotted below 300Hz.
The rise in the upper- and midbass shown in fig.4 is to some extent the effect of the nearfield measurement technique, which assumes a half-space acoustic environment. It is hardly evident in Paul Barton's true anechoic measurements. However, as upper-bass thickness was one of the problems I had to resolve with the T8's room placement, I suspect that the half-space measurement is more indicative of the speaker's behavior in rooms of normal size. Eyeballing through this low-frequency rise in the trace suggests that the T8 has excellent bass extension, with a -6dB point below 30Hz.
The plot of the T8's lateral radiation pattern (fig.5) shows a slight increase in directionality in the octave below the upper crossover frequency, and also above 8kHz. Other than some unevenness in the mid-treble, perhaps due to the relatively wide baffle affecting the tweeter's dispersion, the contour lines in this graph are quite uniform, suggesting that the stereo imaging will be stable and accurate. In the vertical plane (fig.6), the 4kHz suckout in the on-axis response does fill in as noted above. However, it turns into a slight peak more than 10 degrees above or below the tweeter axis. Apart from that, the T8's balance doesn't change appreciably over quite a wide vertical listening window (which is just as well, considering the tweeter is a high 39" from the floor).

Fig.5 PSB Platinum T8, lateral response family at 50", normalized to response on tweeter axis, from back to front: differences in response 90 degrees-5 degrees off-axis, reference response, differences in response 5 degrees-90 degrees off-axis.

Fig.6 PSB Platinum T8, vertical response family at 50", normalized to response on tweeter axis, from back to front: differences in response 15 degrees-5 degrees above axis, reference response, differences in response 5 degrees-15 degrees below axis.
Fig.7 shows how these responses and radiation patterns added up in my listening room. (To generate this curve, I average 120 measurements taken individually for left and right speakers over a window centered on the listening position.) The lack of energy in the 40Hz and 50Hz bands, compared with the slight excess between 80Hz and 160Hz, is due to room effects specific to the speaker positions I found worked best with classical orchestral and piano recordings. But apart from that, the T8 can be seen to offer excellent bass weight down to the 25Hz band.

Fig.7 PSB Platinum T8, spatially averaged, 1/3-octave response in JA's listening room.
In the midrange, there is only a hint of the usual "floor-bounce" dip, presumably due to the speaker using three woofers, each a different distance from the floor. This is what I was expecting. What I did not expect was the 3dB-high plateau in the region covered by the tweeter. Yes, the speakers' rear-facing tweeters were on when I took this measurement, but they put out so little energy that I didn't conceive they could have such an effect on the speaker's commendably flat quasi-anechoic response. And they didn't. When I repeated the measurement with the rear tweeters disconnected, there was no appreciable change in the response. Fig.7 must therefore be showing the effect on the in-room balance of the narrowing of the dispersion in the low treble seen in fig.5. But I was not expecting this degree of modification of the flat axial behavior, given the small radiating diameters of the midrange units. I can only assume that this is the effect of the baffle, with its vertical styling "lips" running down its edges.
The PSB Platinum T8's step response (fig.8) indicates that all the drive-units are connected with positive acoustic polarity, but that the speaker is not time-coherent. However, the fact that the sharp step response of the tweeter blends seamlessly into the slower step of the midrange units, which in turn blends seamlessly into the lazy rise away from the timeline of the woofers, suggests excellent frequency-domain integration of the individual drive-unit outputs, as was seen in fig.4. The farfield cumulative spectral-decay plot is pretty clean (fig.9), with perhaps only the slight degree of hash an octave above the presence region correlating with the slight liveliness in this region I noted in my auditioning.

Fig.8 PSB Platinum T8, step response on tweeter axis at 50" (5ms time window, 30kHz bandwidth).

Fig.9 PSB Platinum T8, cumulative spectral-decay plot at 50" (0.15ms risetime).
Overall, this is excellent measured performance. But the in-room treble balance will be revealing of front-end or amplification problems.—John Atkinson
Footnote 1: I welcome the manufacturers of loudspeakers reviewed in Stereophile sending me their own measurements. Not only does it provide me with a check on my measurements, it helps very much for me to see what the designer has tried to achieve in terms of response flatness and dispersion.—John Atkinson
|
|
| ||||||||||
- Log in or register to post comments


| Loudspeakers Amplification Digital Sources | Analog Sources Accessories Featured | Music Columns Retired Columns | Show Reports | Features Latest News Community | Resources Subscriptions |
 © 2024 Stereophile
AVTech Media Americas Inc., USA
All rights reserved

