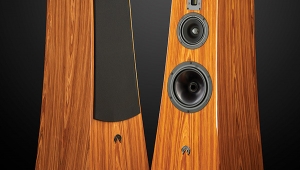
PSB Imagine T2 Tower loudspeaker Measurements

Sidebar 3: Measurements

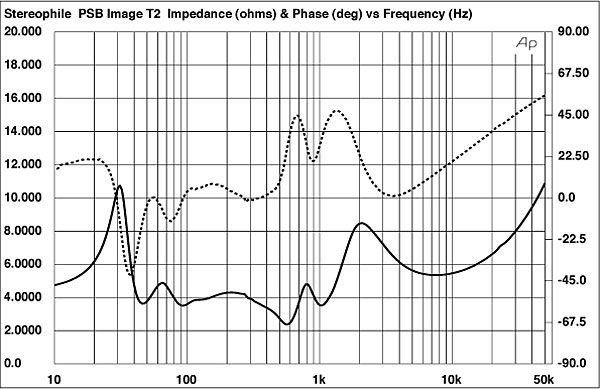
I measured the PSB Imagine T2 Tower using DRA Labs' MLSSA system and calibrated DPA 4006 and Earthworks QTC-40 microphones. The T2 is specified as having an anechoic voltage sensitivity of 88dB; my estimate was slightly lower, at 87.3dB(B), almost within the margin of error. PSB specifies the impedance as being 6 ohms, with a minimum magnitude of 4 ohms. However, as fig.1 shows, the impedance drops below 6 ohms for almost the entire midrange, with a minimum value of 2.4 ohms at 570Hz. The electrical phase angle is also quite inductive in the upper midrange. Overall, it would be best to use a good 4 ohm–rated amplifier or receiver with the Imagine T2.

1113PSBT2fig1.jpg

Fig.1 PSB Imagine T2, electrical impedance (solid) and phase (dashed) (2 ohms/vertical div.).

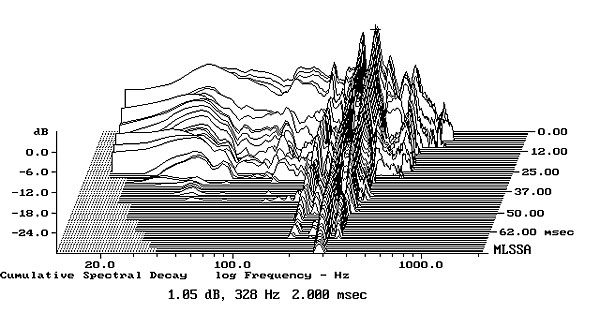
A small wrinkle at 23kHz in the impedance traces suggests that this is the frequency of the tweeter's fundamental "oil-can" resonance. A similar discontinuity in the traces just below 300Hz suggests that there is some enclosure resonance present in this region. Investigating the vibrational behavior of the cabinet's walls with a plastic-tape accelerometer revealed a fairly strong resonance at 328Hz, with lower-level modes at 359 and 281Hz (fig.2). The exact proportions of these three resonances varied depending on where I placed the accelerometer. Though Robert Deutsch noted some minor "box resonances" at very high levels, he didn't mention hearing any midrange congestion. It's possible, therefore, that this behavior measures worse than it sounds.

1113PSBT2fig2.jpg

Fig.2 PSB Imagine T2, cumulative spectral-decay plot calculated from output of accelerometer fastened to center of side panel level with bottom woofer (MLS driving voltage to speaker, 7.55V; measurement bandwidth, 2kHz).

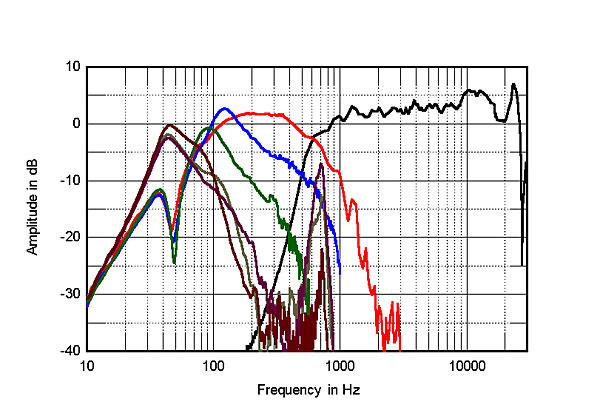
To the left of fig.3 are shown the individual nearfield responses of the midrange drive-unit, the three woofers, and the three ports; on the right are the farfield responses of the tweeter and midrange (black trace) and the woofers (red trace above 350Hz). The upper crossover appears to occur around 600Hz rather than the specified 500Hz, with steep filter slopes. The woofers all cover different passbands; to my surprise, it was the middle woofer (red trace) that extended highest in frequency, the top woofer (blue) having a more restricted bandwidth; the bottom woofer's bandwidth was even more restricted (green). The ports (gray, brown, and dark red traces) all peak between 35 and 75Hz, and the top port (gray) and the middle port (dark red) have peaks visible in their midrange outputs. All three woofers have minimum-motion notches apparent between 47 and 49Hz, the frequency of the saddle in the impedance-magnitude plot.

1113PSBT2fig3.jpg

Fig.3 PSB Imagine T2, acoustic crossover on tweeter axis at 50", corrected for microphone response, with nearfield responses of midrange unit (black), top woofer (blue), middle woofer (red), bottom woofer (green), top port (gray), middle port (dark red), bottom port (brown), respectively plotted below 450Hz, 1kHz, 350Hz, 700Hz, 900Hz, 900Hz, 800Hz.

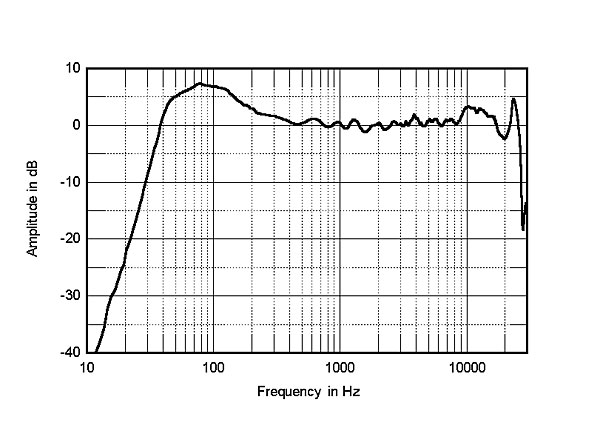
The Imagine T2's manual implies that the optimal response will be obtained on the tweeter axis. Fig.4 shows the speaker's farfield response, averaged across a 30° horizontal window on the tweeter axis and spliced at 300Hz to the complex sum of the nearfield responses plotted. The T2 is superbly flat in the midrange and treble, with just a slight amount of excess energy apparent above 9kHz. Much of the low-frequency boost will be an artifact of the nearfield measurement technique, which assumes a 2pi (half-space) acoustic environment for the drive-units rather than the usual 4pi. But there does appear to be a little too much bass energy. As RD said of the T2's bass, it was "deeper and more powerful than I would have expected, given the driver complement and the size of the cabinet."

1113PSBT2fig4.jpg

Fig.4 PSB Imagine T2, anechoic response on tweeter axis at 50", averaged across 30° horizontal window and corrected for microphone response, with complex sum of nearfield responses plotted below 300Hz.

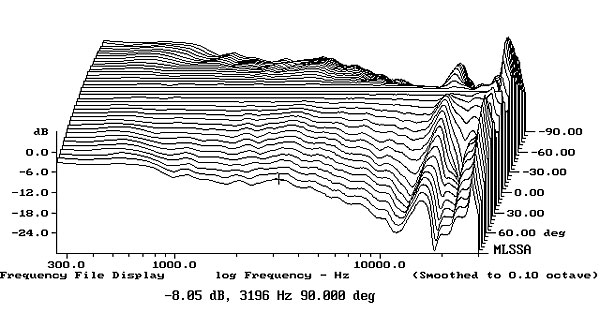
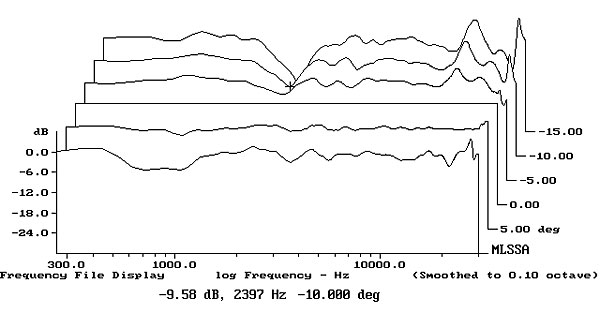
As I expected from its narrow baffle and small-diameter drivers, the Imagine T2's lateral dispersion was textbook perfect below the top octave (fig.5), with a smooth, even, controlled rolloff at higher frequencies to the speaker's sides. However, the fact that more top-octave energy is apparent off-axis might exacerbate the on-axis excess in the same region. Even so, it's fair to note that RD found the T2's highs to sound sweet, smooth, and extended. The T2's tweeter is 35" from the floor; the speaker's plot of vertical dispersion, normalized to the tweeter-axis response (fig.6), indicates the development of a suckout at the upper crossover frequency (which appears to be 2.4kHz) more than 5° above that axis. As is almost always the case, this is not a speaker to be listened to when standing up.

1113PSBT2fig5.jpg

Fig.5 PSB Imagine T2, lateral response family at 50", normalized to response on tweeter axis, from back to front: differences in response 90–5° off axis, reference response, differences in response 5–90° off axis.

1113PSBT2fig6.jpg

Fig.6 PSB Imagine T2, vertical response family at 50", normalized to response on tweeter axis, from back to front: differences in response 15–5° above axis, reference response, differences in response 5–10° below axis.

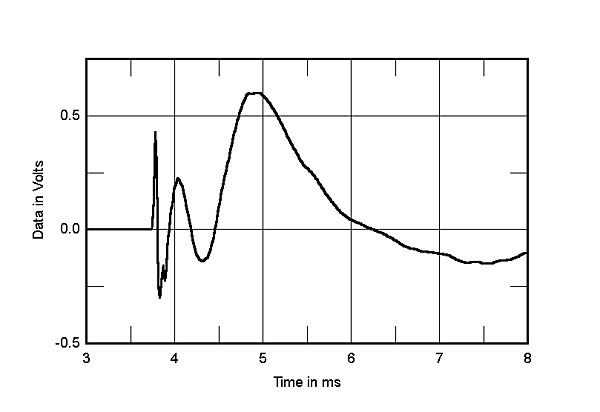
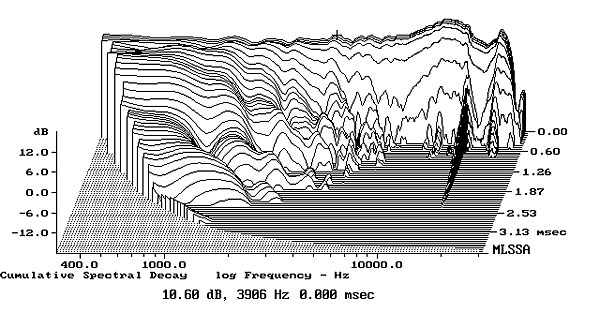
The Imagine T2's step response on the tweeter axis (fig.7) shows that all five drive-units are connected in positive acoustic polarity, and that, as is usually the case with a flat-baffled speaker, first to arrive at the microphone is the tweeter's output, followed by that of the midrange, then that of the woofers. The decay of the midrange step smoothly blends with that of the woofers, implying optimal crossover design. However, a slight discontinuity in the decay of the tweeter's step suggests that the optimal blend between the tweeter's output and that of the midrange driver will actually occur just above the tweeter axis. The T2's cumulative spectral-decay plot (fig.8) is clean in the treble.

1113PSBT2fig7.jpg

Fig.7 PSB Imagine T2, step response on tweeter axis at 50" (5ms time window, 30kHz bandwidth).

1113PSBT2fig8.jpg

Fig.8 PSB Imagine T2, cumulative spectral-decay plot on tweeter axis at 50" (0.15ms risetime).

As has every other PSB speaker we have reviewed at Stereophile, the Imagine T2 Tower's measurements offer a clean bill of measured health.—John Atkinson

COMPANY INFO
PSB Speakers
633 Granite Court
Pickering, Ontario L1W 3K1
Canada
(905) 831-6555
ARTICLE CONTENTS

COMMENTS
TreAdidas's picture

I too pair PSB speakers with PrimaLuna amplification and have been quite happy with it.  I myself run the Synchrony 2 tower driven by PrimaLuna Prologue Sevens; similar to the system reviewed, albeit with 6 year old equipment (is that considered vintage?crying...cool).  Given that the Synchrony 2 Tower and the Imagine T2 share that $3,500 price point, it seems PSB felt their efforts at $3,500 were better off by adding that 4” midrange and scaling back the exotic driver materials.  I’d be curious to hear what improvements or perhaps just what differences there are between the Synchrony 2 tower and the Imagine T2 tower. 

I also wanted to echo the comments about detail and power.  When determining which components to buy, I was a bit concerned that the PrimaLunas (which I already owned) would not have enough power to run the PSBs.  A few searches on different forums will reveal the consensus that PSBs are power hungry.  I was worried I would experience constrained dynamics and at worst get some distortion.  I am happy to report that while the volume knob now approaches 12:00 whereas it used to be firmly planted at 10:00, I am pleased with the decision to 86 my Vandersteen Model 2 and substitute the PSB Synchrony 2 tower.  Provided you’re not interested in waking up the neighbors, I have found the PSB/PrimaLuna combo to be very … “smile-worthy” (how’s that for audiophile jargon!).  In all seriousness I have found the dynamic range to be very adequate though I do wonder, curiosity be damned, what some nice solid-state monoblocs would do for me.   I have also found the sound to be very detailed, though never overly sibilant.  Robert D. calls it combining accuracy and euphoria.  Whatever your terminology, it is a pretty neat trick to pull off for such a relatively reasonable price. 

The T2 will make lots of folks very happy.  That I am sure.  
WLV's picture

I just can not understand, to start with, how a speaker manufacturer would demonstrate his high-end loudspeakers with poorly associated components. Developingt the said loudspeaker requires, I suppose, a lot of listening. Now, if you want to talk about room acoustics, I'm your man.

Robert Deutsch's picture

Although it's safe to say that no speaker manufacturer would deliberately use demo equipment that represents a poor match with their speakers, I've certainly heard demo systems where I felt that the associated equipment did not show the speaker to its maximum potential.  The choice of associated equipment at an audio show is often determined by relationships among exhibitors.  A speaker manufacturer may be good friends with a manufacturer of amplifiers that are good in a general sense, but not a particularly favorable match with these speakers.  To pay for the exhibition room, it's often necessary for manufacturers to share these costs, and it can lead to a speaker and amplifier manufacturer exhibiting with each other's products, with neither product  being shown to its maximum advantage.  Politically, it would be difficult for a speaker manufacturer to share a room with an amplifier manufacturer and not to use that amplifier manufacturer's products to demo the speakers--and the amp manufacturer to use using different speakers to demo their equipment.   I remember seeing this type of arrangement just once at an audio show, and the atmosphere between the two exhibitors sharing the room was decidedly frosty.

An even greater restriction of equipment choice is where speakers and amplifiers have the same distributor, and while each product may be fine on its own, they're not ideally matched.  And I'll give just one more example: a manufacturer that produces both speakers and amplifiers, where the speakers are truly excellent, but the amps do not match that level of excellence.  Again, there's no way the manufacturer would demo their speakers with anything other than their own amps. 

rcb3n474's picture

I demoed these speakers in my home for two months after reading all of the good reviews. I found the treble very harsh and metallic sounding. I tried three different amps, two sources, and two different sets of cables. Nothing helped. I find it odd that no reviewer has mentioned this. I can't be the only one that hears it.

Dr.Kamiya's picture

The harsh treble is real, and seems to be caused by a response peak that shows up both in measurements and in listening if you can hear up to 17kHz.

PSB uses the same tweeter across all their lines and when John Atkinson (who can hear up to 15kHz) reviewed the Synchrony One he heard the peak as "a lift in the presence region". But staffer Erick Lichte (who is younger and can hear to 19kHz) was less tolerant of that response peak, hearing it as outright harshness.

This is mentioned in page 2 and in the measurements section of JA's Synchrony One review.

JA remarks in the measurements section:

"A couple of small peaks can be seen close to the upper edge of the audioband, and I do wonder if these were the reason Erick Lichte was less tolerant of the Synchrony One's top-octave performance than I was. My hearing cuts off above 15.5kHz these days, while Erick's extends to 19kHz. Then again, he's half my age."

HTH

X