PSB Imagine T loudspeaker Measurements

Sidebar 4: Measurements

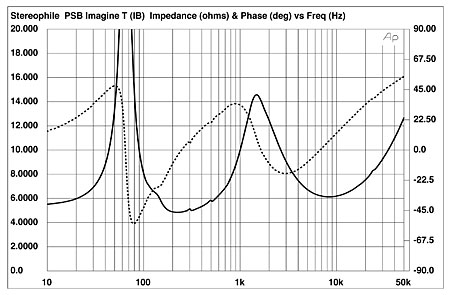
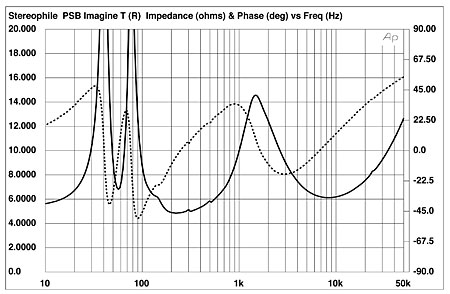
The PSB Imagine T's voltage sensitivity was to specification, at 88dB(B)/2.83V/m. Its impedance with both ports open (fig.1) dropped to just below 5 ohms in the lower midrange, but averaged 8 ohms at higher frequencies with, as usual, the larger electrical phase angle occurring when the magnitude was high, which will ameliorate the drive difficulty this might otherwise have caused. The saddle centered on 56Hz in the magnitude trace in this graph suggests that this is the tuning frequency of the twin ports. With both ports plugged, which is what Kal Rubinson found gave the flattest in-room response, the Imagine T's impedance curve (fig.2) now resembles that of a sealed-box design tuned to 66Hz.

Fig.1 PSB Imagine T, electrical impedance (solid) and phase (dashed), both ports open (2 ohms/vertical div.).

Fig.2 PSB Imagine T, electrical impedance (solid) and phase (dashed), both ports closed (2 ohms/vertical div.).

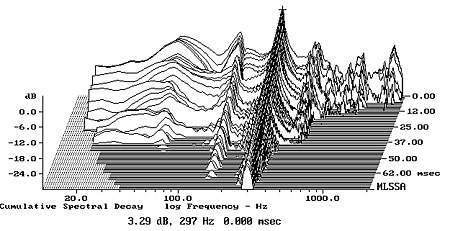
The traces in figs. 1 and 2 have significant discontinuities at 300Hz and just below 600Hz. Investigating the enclosure panels' vibrational behavior with a plastic-tape accelerometer, I found a strong resonant mode at 297Hz on the sidewall (fig.3) and on other surfaces, which is low enough in frequency and high enough in amplitude to be potentially audible. However, predicting the audibility of this behavior is difficult, because it will also depend on the radiating area involved and the acoustic phase of the vibration. I note that KR didn't comment on any lack of midrange clarity that might have resulted from this resonance, though he did comment that the cabinet was lively to the touch.

Fig.3 PSB Imagine T, cumulative spectral-decay plot calculated from output of accelerometer fastened to side panel 8" from top (MLS driving voltage to speaker, 7.55V; measurement bandwidth, 2kHz).

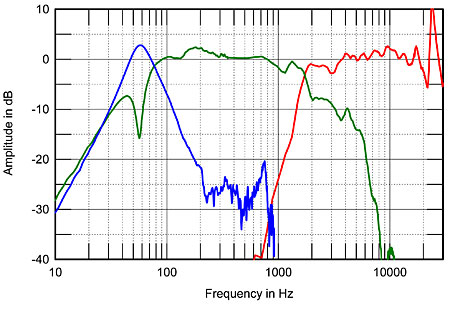
The Imagine T woofers are specified as behaving somewhat differently, the lower rolling off a little earlier than the upper in order to optimize the transition to the tweeter. I found that the lower woofer had a little more energy between 500Hz and 1kHz, but then rolled off above 1kHz, leaving the upper woofer to extend higher in frequency. Otherwise, the woofers behaved very similarly—interestingly, each had notches in its nearfield output at 300 and 590Hz, the frequencies of the discontinuities in the impedance traces—and the sum of their responses with the ports open is shown in fig.4 (green trace).

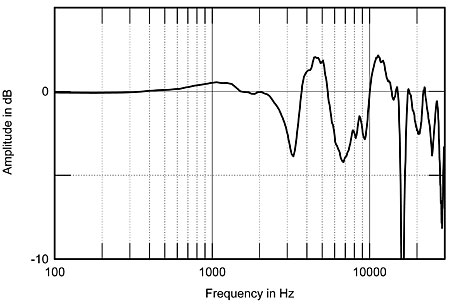
Fig.4 PSB Imagine T, acoustic crossover on tweeter axis at 50", corrected for microphone response, with summed nearfield responses of woofers (green) and ports (blue), scaled in the ratio of the square roots of their radiating areas.

The sharply defined notch at 56Hz, which is where the woofer cones are held stationary by the back pressure from the port resonance, is the tuning frequency of the ports, as expected from fig.1. The ports, too, behave similarly, and the sum of their outputs (fig.4, blue trace) sharply peaks between 40 and 90Hz, with a generally clean rolloff above that region. Higher in frequency in fig.4, the woofers are very flat within their passband and cross over to the tweeter just below 2kHz, with a little more overlap between the upper woofer and the tweeter than is strictly necessary. The tweeter is also flat within its passband, but has the usual metal-dome peak evident above the audioband.

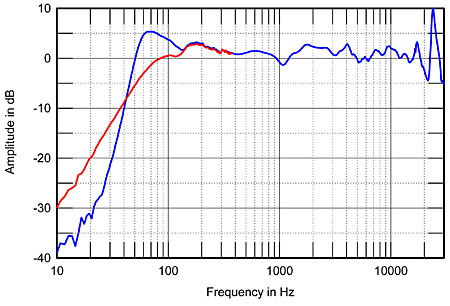
The overlap at the crossover frequency leads to a slight excess of energy in this region in the Imagine T's farfield response (fig.5), but even so, the speaker is very well behaved in the frequency domain. The blue trace below 300Hz in this graph shows the complex sum of the nearfield woofer and port responses. The rise in output between 50 and 120Hz is only partly due to the nearfield measurement technique; with both ports open, the speaker's bass alignment does appear to be a little underdamped. Plugging the ports gives the red trace in fig.5, which features the classic 12dB/octave rolloff below the resonant frequency. This will result in a little more LF extension in the listening room than the reflex alignment, but might sound a touch lean. However, I note that KR ultimately preferred the sound of the Imagine Ts with both ports plugged. With one port plugged, the speaker will feature a low-frequency response midway between the red and blue traces in fig.5.

Fig.5 PSB Imagine T, anechoic response on tweeter axis at 50", averaged across 30° horizontal window and corrected for microphone response, with complex sum of nearfield woofers' and ports' responses plotted below 300Hz (blue), and with sum of woofer responses with both ports closed (red).

Kal auditioned the PSBs without their grilles. Fig.6 shows that the grille does introduce some major changes in the speaker's treble response, presumably from reflections from the perforated metal. To get the smoothest treble output from the Imagine Ts, their grilles should be left off.

Fig.6 PSB Imagine T, effect of grille on tweeter-axis response (5dB/vertical div.).

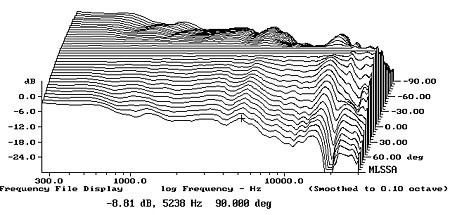
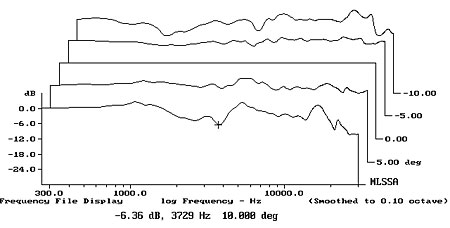
The PSB's horizontal dispersion (fig.7) is textbook in the smoothness of the off-axis traces and the evenness with which the high frequencies shelve down at increasing off-axis angle. Yes, there is a very slight flare evident at the cursor position (5.24kHz), but this actually coincides with a slight depression in the on-axis output. Vertically (fig.8), the Imagine T's output doesn't change significantly over a wide angle (+10°, –5°) centered on the tweeter axis, which is 35" above the floor.

Fig.7 PSB Imagine T, lateral response family at 50", normalized to response on tweeter axis, from back to front: differences in response 90–5° off axis, reference response, differences in response 5–90° off axis.

Fig.8 PSB Imagine T, vertical response family at 50", normalized to response on tweeter axis, from back to front: differences in response 10–5° above axis, reference response, differences in response 5–10° below axis.

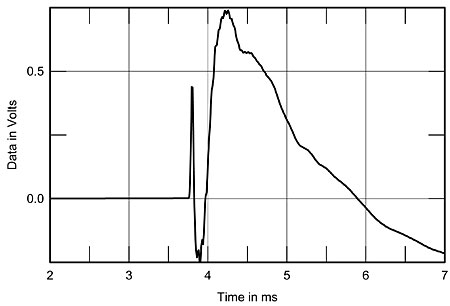
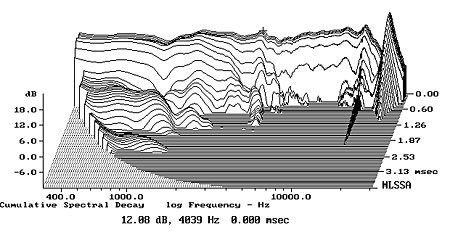
The Imagine T's step response on the tweeter axis (fig.9) indicates that all three drive-units are connected with the same positive acoustic polarity, while the cumulative spectral-decay plot (fig.10) is superbly clean, other than a very slight amount of delayed energy at 4kHz and the usual ridge at the tweeter's ultrasonic dome resonance.

Fig.9 PSB Imagine T, step response on tweeter axis at 50" (5ms time window, 30kHz bandwidth).

Fig.10 PSB Imagine T, cumulative spectral-decay plot on tweeter axis at 50" (0.15ms risetime).

Overall, PSB's Imagine T demonstrates superb measured performance that lives up to its pedigree.—John Atkinson

COMPANY INFO
PSB Speakers International
633 Granite Court
Pickering, Ontario L1W 3K1
Canada
(888) 772-0000
ARTICLE CONTENTS

COMMENTS
Ken Rieman's picture

Alright Imagine T friends, my wife and I just acquired a pair of these great speakers and we're shopping for a new integrated amp (or separates) and DAC.

We'd like to keep the total for these to about $3K.

I'd love to hear from others who have experience with these.  We've home auditioned most of the reasonable candidates we have easy access to in North Seattle.  So far, the NAD C-165/275 Separates with the Musical Fidelity M-1 DAC have sounded best to us.  The NAD C-375 was close behind.  We're waiting on a Naim Nait 5i and we'll test it with the Rega DAC next week.

We listened to, but rejected the Rega Brio R (underpowered), Linn DS-I (over-smooth, narrower sound-stage, low-end opacity), NAD C-390DD (hollow), Rotel RA-1520 (overcool), Parasound P3/A21-3 (boring)

I'm also a newbie to higher-end cables.  I don't want to spend too much on these, but would be happy to find the best match I can.  When we were listening with the NAD separates, I could have still wished for a bit more grip and definition in the mid-bass.  (We have a Velodyne VA 1210 100W powered sub that does a decent job crossed over at 50Hz.)  I attribute this mostly to the dynamics of our small living room.

Also, we plan to connect my Technics SL1200 MKII phonograph, so phono stage is a consideration.

Thanks, in advance, for your thoughts.
Bleslie889's picture

Hi I had a question about your post. I have the Rotel 1520 and am thinking of buying the Imagine T's but will not be able to preview them together. When you describe their pairing as "over cool" what exactly does that mean?  Any feedback on your impression listening to the two together is appreciated. 

X