| Columns Retired Columns & Blogs |
PSB Image B6 loudspeaker Measurements
Sidebar 3: Measurements
I performed the quasi-anechoic measurements of the PSB Image B6 with DRA Labs' MLSSA system and a calibrated DPA 4006 microphone. The speaker's grille was left off for the measurements. The Image B6's specified voltage sensitivity is 89dB/2.83V/m; my estimate was slightly lower, at 88dB(B)/2.83V/m, but this is close to being within experimental error of the specified figure. The PSB is specified as having an impedance of 6 ohms with a minimum of 4 ohms; fig.1 shows that the impedance magnitude stays above 6 ohms for the upper midrange and treble regions, but does drop to 4 ohms at 40Hz and to 3.6 ohms at 170Hz, with an awkward combination of 5.5 ohms and –43° electrical phase angle at 104Hz. None of this should present an amplifier or receiver rated at 4 ohms with any drive problems.
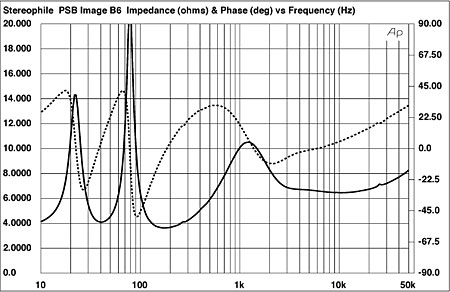
Fig.1 PSB Image B6, electrical impedance (solid) and phase (dashed) with port open (2 ohms/vertical div.).
The small wrinkle in the impedance traces at 25.4kHz suggest that this is the frequency of the metal-dome tweeter's primary resonance. A similar wrinkle between 200 and 300Hz implies that there is a cabinet resonance of some kind in this region. Investigating the enclosure's vibrational behavior with an accelerometer, I found a fairly strong mode at 266Hz present on all surfaces (fig.2). However, I note that Bob Reina didn't comment on any midrange congestion that might be due to the presence of this resonance, but it might add to the B6's "warm" balance.
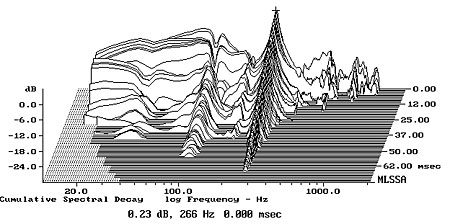
Fig.2 PSB Image B6, cumulative spectral-decay plot calculated from output of accelerometer fastened to center of side panel (MLS driving voltage to speaker, 7.55V; measurement bandwidth, 2kHz).
The saddle centered at 40Hz in the impedance-magnitude traces suggests that this is the tuning frequency of the rear-facing port, and, indeed, the minimum-motion frequency in the woofer's nearfield output (fig.3, blue trace) lies at 40Hz. The port's output peaks broadly in the midbass, with a clean rollout above 90Hz, though a low-level mode is apparent at 900Hz (fig.3, red trace). The woofer does peak a little more than expected in the upper bass, and the overlap between its output and that of the tweeter (fig.3, green trace) is quite broad, with an actual crossover point at about 2.2kHz rather than the specified 1.8kHz. The tweeter's ultrasonic resonance does lie at 25.4kHz, as predicted by the impedance graph.
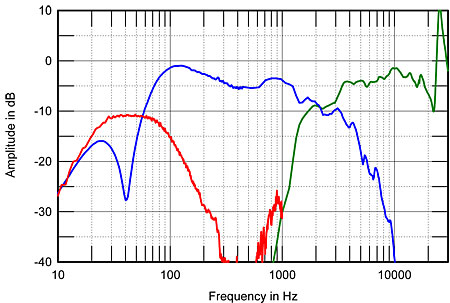
Fig.3 PSB Image B6, acoustic crossover on tweeter axis at 50", corrected for microphone response, with nearfield responses of port (red) and woofer (blue), plotted below 1kHz and 350Hz, respectively.
Fig.4 shows how these individual responses sum on the tweeter axis in the farfield, taking into account acoustic phase and the different distances of the woofer and port from a nominal farfield microphone position. Most of the peak in the upper bass will be an artifact of the nearfield measurement technique used in this region, but the Image B6 is, as BJR suspected, balanced to be a little on the warm side. The overall response is commendably even, especially given how inexpensive this speaker is, though the slightly exaggerated treble will usefully balance the warmish lows.
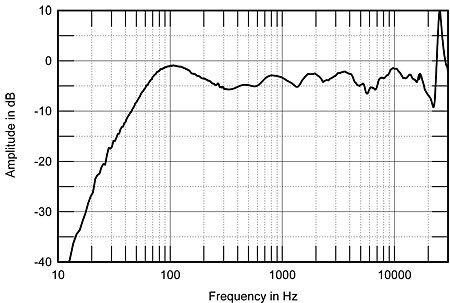
Fig.4 PSB Image B6, anechoic response on tweeter axis at 50", averaged across 30° horizontal window and corrected for microphone response, with complex sum of woofer and port nearfield responses, plotted below 300Hz.
Bob commented on the Image B6s' fine stereo imaging and their ability to "throw a wide, deep soundstage." This is what I would have expected from the speaker's neutral on-axis balance and its even, well-controlled lateral dispersion (fig.5). The slight apparent flare off-axis between 5 and 6kHz in this graph is actually due to the on-axis suckout in the same region filling in to the speaker's sides. In the vertical plane (fig.6), a hefty suckout in the crossover region develops for axes above the top of the cabinet. The stands used should be tall enough to place the listener's ears between the woofer dustcap and the top of the cabinet.
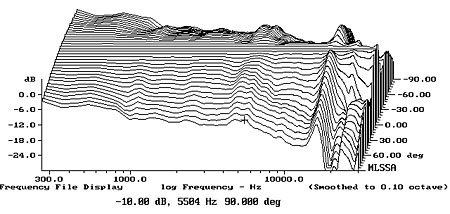
Fig.5 PSB Image B6, lateral response family at 50", normalized to response on tweeter axis, from back to front: differences in response 90–5° off axis, reference response, differences in response 5–90° off axis.
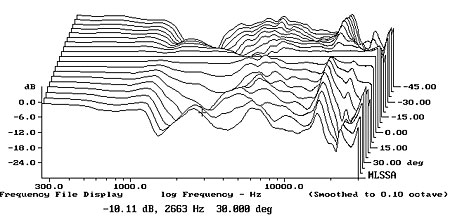
Fig.6 PSB Image B6, vertical response family at 50", normalized to response on tweeter axis, from back to front: differences in response 45–5° above axis, reference response, differences in response 5–45° below axis.
Turning to the time domain, the PSB's step response on the tweeter axis (fig.7) is absolutely conventional, with both drive-units connected in positive acoustic polarity, the tweeter's output leading that of the woofer by about a quarter of a millisecond, and the tail of the tweeter's step smoothly blending into the start of the woofer's step. (The latter always correlates with optimal integration of the drive-units' outputs in the frequency domain.) Though there is a small reflection apparent at the 5ms marker in the tail of the woofer's step response, this doesn't appear to give rise to any delayed-energy problems in the Image B6's cumulative spectral-decay plot (fig.8)—which, other than the expected ridge of energy at the tweeter's ultrasonic resonance frequency, is extremely clean.
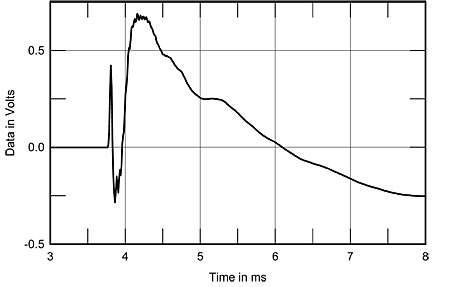
Fig.7 PSB Image B6, step response on tweeter axis at 50" (5ms time window, 30kHz bandwidth).
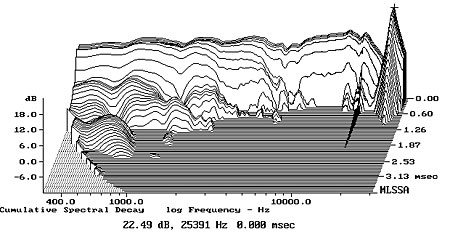
Fig.8 PSB Image B6, cumulative spectral-decay plot on tweeter axis at 50" (0.15ms risetime).
As I told Bob Reina when he was about to submit his review text to me, PSB's Image B6 is "as well-engineered a design as is to be expected from Paul Barton." (Note that I did not give him any details of the measured performance until after he had sent me the review.) In light of the speaker's price of just $495/pair, this engineering quality is especially commendable.—John Atkinson
|
| ||||||||||
- Log in or register to post comments


| Loudspeakers Amplification Digital Sources | Analog Sources Accessories Featured | Music Columns Retired Columns | Show Reports | Features Latest News Community | Resources Subscriptions |
 © 2024 Stereophile
AVTech Media Americas Inc., USA
All rights reserved

