| Columns Retired Columns & Blogs |
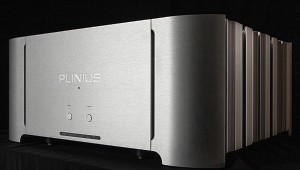
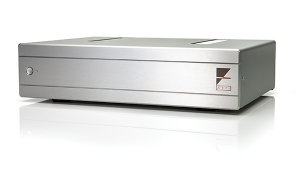
Plinius SA-100 Mk.II power amplifier Measurements
Sidebar 3: Measurements
A full set of measurements of the second sample of the Plinius SA-100 Mk.II was made in its unbalanced mode, in class-A operation, with selected measurements repeated in class-AB. The amplifier would not function properly in balanced mode, producing noise and hum levels that swamped any attempt at accurate measurement. This is consistent with WP's observations, and is the reason no balanced results are presented here. This is a serious shortcoming for the user who desires balanced operation, and needs to be investigated by the manufacturer if they plan to market the amplifier in the US as a balanced device.
Following the 1/3-power, one-hour preconditioning test, the SA-100 Mk.II's heatsinks were hot but not uncomfortably so in class-AB. Following a much shorter time idling in class-A, however, the case and heatsinks became very hot—not hot enough to cause concern for the amplifier, but hot enough to demand caution for those with small children—and for summer operation! Our measurements of the Plinius's bias current indicate that it operates at up to 114.5W in full class-A into an 8 ohm load, and up to 57.3W at class-A into 4 ohms. Above these power levels, the amplifier will transition to class-AB until it clips.
The input impedance of the SA-100 Mk.II measured 46.3k ohms. The output impedance was 0.027 ohms or less at 1kHz and 20Hz, increasing slightly to 0.038 ohms at 20kHz with a 4 ohm load; this should not affect in any way the system's frequency response into different loudspeaker loads.
Voltage gain into 8 ohms measured a high 31.5dB. Signal/Noise (ref. 1W into 8 ohms) measured 74dB over a 22Hz–22kHz bandwidth, 72.9dB over a 10Hz–500kHz bandwidth, both unweighted, and 79.1dB, A-weighted. The SA-100 Mk.II is noninverting in the unbalanced mode.
Fig.1 shows the SA-100 Mk.II's frequency response. The results are near-overlays at various test loads; even our simulated real load did nothing but create a barely visible dip at 5kHz. The slight rolloff at high frequencies may well be audible as a slightly sweetened sound. The 10kHz squarewave shown in fig.2 is a little less pristine, with noticeable overshoot. It is well-damped, however, with no oscillation. (This is also visible on the 1kHz squarewave, not shown.) Fig.3 shows the SA-100 Mk.II's crosstalk. This is a very good result, the channels evenly matched (which, at these low levels, is probably not very significant).

Fig.1 Plinius SA-100, frequency response at (from top to bottom at 20kHz): 1W into 8 ohms, and 2.83V into simulated speaker load (right channel dashed, 0.5dB/vertical div.).

Fig.2 Plinius SA-100, small-signal 10kHz squarewave into 8 ohms.

Fig.3 Plinius SA-100, crosstalk (from top to bottom at 20kHz): R–L, L–R (10dB/vertical div.).
The THD+noise vs frequency curves are plotted in fig.4. The distortion in class-A is actually slightly higher than in class-AB, though the difference is small and likely due to noise. The waveform of the distortion is shown in fig.5. The level for this measurement was 4W into 4 ohms (it was difficult to obtain a reading at lower power). The distortion at this output power is heavily third-harmonic plus noise. It is also primarily third-harmonic into 8 ohms and 2 ohms (not shown), though some higher-order components are more evident with the lower impedance load.

Fig.4 Plinius SA-100, THD+noise vs frequency at (from top to bottom at 10kHz): 4W into 2 ohms, class-A; 1W into 8 ohms, class-AB (right channel dashed).

Fig.5 Plinius SA-100, 1kHz waveform at 4W into 4 ohms, (top); distortion and noise waveform with fundamental notched out (bottom, not to scale).
The spectral response of the SA-100 Mk.II to a 50Hz input at 144W into 4 ohms is shown in fig.6. All artifacts are below –80dB (0.01%), though once again the third harmonic is the highest in level. Fig.7 shows the output spectrum resulting from a combined 19+20kHz signal at 105W into 4 ohms. This is also a fine result, with the 1kHz intermodulation product barely exceeding –80dB at –74dB (about 0.02%). The 18kHz artifact is at –56.5dB (about 0.15%). The artifacts at 63W into 8 ohms (not shown) are generally even lower.

Fig.6 Plinius SA-100, spectrum of 50Hz sinewave, DC–1kHz, at 144W into 4 ohms (linear frequency scale).

Fig.7 Plinius SA-100, HF intermodulation spectrum, DC–22kHz, 19+20kHz at 105W into 4 ohms (linear frequency scale).
The 1kHz THD+noise vs level curves for the SA-100 Mk.II are shown in fig.8. The maximum outputs for class-A and class-AB are nearly identical, though the THD in the mid-power regions may be seen to be generally lower for class-A operation (at lower powers, noise dominates the readings). The discrete clipping levels are shown in Table 1.

Fig.8 Plinius SA-100, distortion (%) vs output power into (from bottom to top at 40W): 8 ohms, class-A; 8 ohms, class-AB; 4 ohms, class-A; 4 ohms, class-AB; 2 ohms, class-A; and 2 ohms, class-AB.
Table 1 Plinius SA-100 Mk.II Discrete Clipping Levels
(1% THD+noise at 1kHz), class-A setting
| Both Channels Driven | One Channel Driven | ||
| Load | W (dBW) | W (dBW) | |
| ohms | (L) | (R) | (L) |
| 8 | 133.6 (21.26) | 133.6 (21.26) | 135.9 (21.33) |
| 115V | 115V | 115V | |
| 4 | 210.6 (20.23) | 207.3 (20.17) | 216.6 (20.37) |
| 115V | 114V | 115V | |
| 2 | 288 (18.6) | ||
| 115V | |||
This is a solid set of test measurements, if just a little short of the very best frequency and squarewave responses. Though WP heard increasing noise with time, I saw/measured no evidence of this with the second sample on the bench.—Thomas J. Norton
- Log in or register to post comments


