| Columns Retired Columns & Blogs |
Peachtree iDac D/A converter Measurements
Sidebar 3: Measurements
I used Stereophile's loan sample of the top-of-the-line Audio Precision SYS2722 system to measure the Peachtree iDac (see www.ap.com and the January 2008 "As We See It"); for some tests, I also used my vintage Audio Precision System One Dual Domain and the Miller Audio Research Jitter Analyzer. As well as driving the iDac with S/PDIF data from the Audio Precision analyzers, I used my iPod Classic 160GB, and a MacBook running Mac OS10.6.8 and Pure Music 1.8, to play test-signal files. I indicate in the text where I found significant measured differences between the iDac's NAL and NOS filters and between its Hi-Bit and Lo-Bit modes. If I don't mention a difference, assume that there was none.
When I examined the iDac's properties with my Mac's AudioMidi Set-Up and USB Prober utilities, I was at first confused: They said there were two iDacs connected. However, one of the alleged pair was for two-channel analog inputs, which are not functional on the iDac. The outputs were identified as "Peachtree 24/96" from "Lakewest Audio," and as being capable of functioning with 24-bit data at sample rates of 32, 44.1, 48, and 96kHz, but unfortunately not 88.2kHz. The mode of USB operation was "isochronous adaptive," with a 1ms polling interval.
The maximum output level at 1kHz differed slightly between Hi-Bit and Lo-Bit, at 2.117 and 1.941V, respectively. The iDac's analog output inverted polarity under all conditions. The output impedance was very low, at 10.4 ohms at all audio frequencies (including 6' of interconnect). Channel separation was superb, at >120dB below 2kHz. Fig.1 shows the iDac's frequency response using the NAL filter with S/PDIF data having sample rates of 44.1, 96, and 192kHz. (Generic, plastic-cored TosLink cables would work only up to 96kHz; I used a coaxial datalink for the 192kHz measurement.) The overall response follows the same ultrasonic curve, but with each of the lower-sample-rate results cutting off sharply just below half the sampling frequency. This graph was taken into 100k ohms; substituting the demanding 600 ohm load didn't change the result other than the drop in level due to the interaction between the iDac's source impedance and the different load impedances.
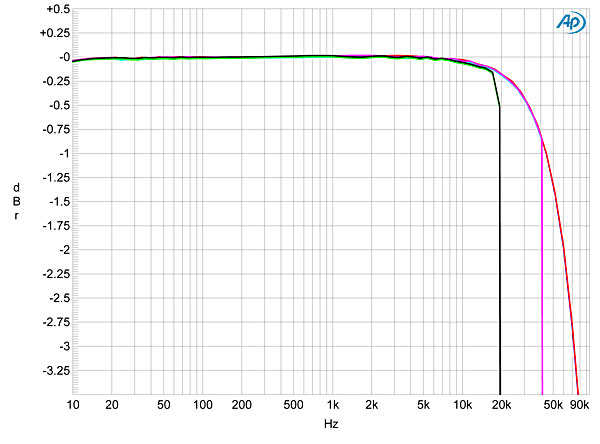
Fig.1 Peachtree iDac, NAL filter, frequency response at –12dBFS into 100k ohms from balanced outputs with data sampled at: 44.1kHz (left channel green, right gray), 96kHz (left cyan, right magenta), 192kHz (left blue, right red). (0.25dB/vertical div.)
Changing to the NOS filter gave a very different result, with each sample rate featuring an early rolloff (fig.2). With 44.1kHz data, for example, the output was –1dB at 20kHz. The benefit that results from this slightly premature rolloff is optimal time-domain performance, which can be seen by comparing the impulse responses of the iDac's NAL filter (fig.3) and NOS filter (fig.4). The former has the symmetrical ringing typical of a linear-phase, finite-impulse-response low-pass filter; the latter has an almost perfect impulse shape, with minimal overshoot and no ringing. However, both are in inverted polarity.
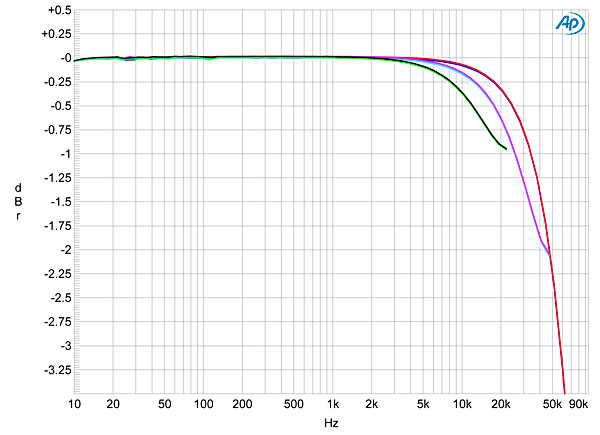
Fig.2 Peachtree iDac, NOS filter, frequency response at –12dBFS into 100k ohms from balanced outputs with data sampled at: 44.1kHz (left channel green, right gray), 96kHz (left cyan, right magenta), 192kHz (left blue, right red). (0.25dB/vertical div.)
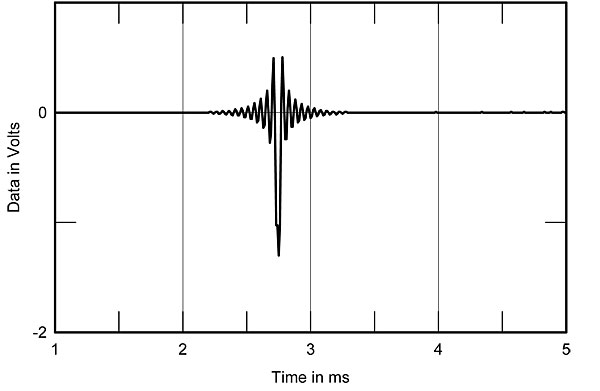
Fig.3 Peachtree iDac, NAL filter, impulse response (4ms time window).
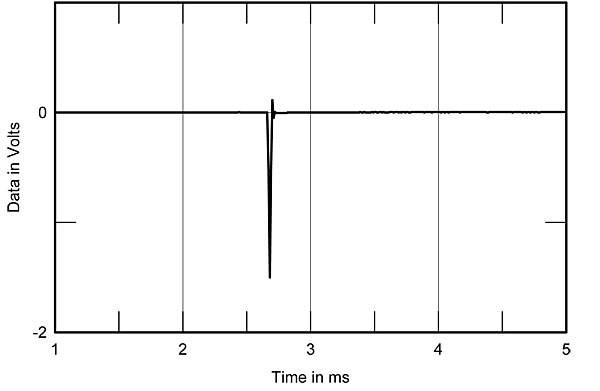
Fig.4 Peachtree iDac, NOS filter, impulse response (4ms time window).
I tested the Peachtree's resolution in my usual fashion, feeding it 16- and 24-bit data representing a dithered 1kHz tone at –90dBFS while sweeping the center frequency of a 1/3-octave bandpass filter from 20kHz to 20Hz; the resulting spectra, taken in Hi-Bit mode, are shown in fig.5. The traces peak at exactly –90dBFS, suggesting very low linearity error, with no distortion– or power-supply–related spuriae visible for 16-bit data. The increase in bit depth drops the noise floor by around 18dB, implying 19-bit resolution, which is confirmed by the FFT spectra in fig.6, but it also unmasks a supply component in the left channel: 60Hz at –132dBFS (!). The bottom pair of traces in fig.5 show the spectrum of 24-bit data representing a dithered 1kHz tone at –120dBFS; it is readily resolved by the iDac.
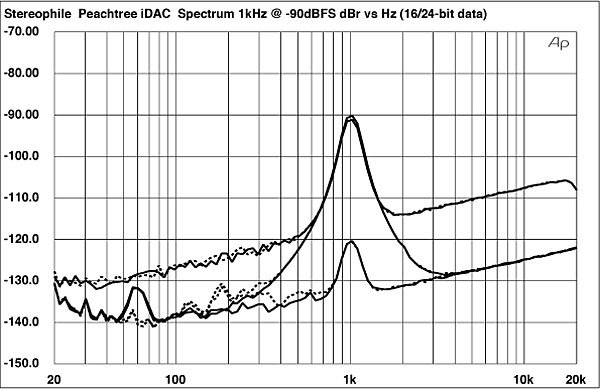
Fig.5 Peachtree iDac, Hi-Bit, 1/3-octave spectrum with noise and spuriae of dithered 1kHz tone at –90dBFS, with: 16-bit data (top), 24-bit data (middle); dithered 1kHz tone at –120dBFS with 24-bit data (bottom). (Right channel dashed.)
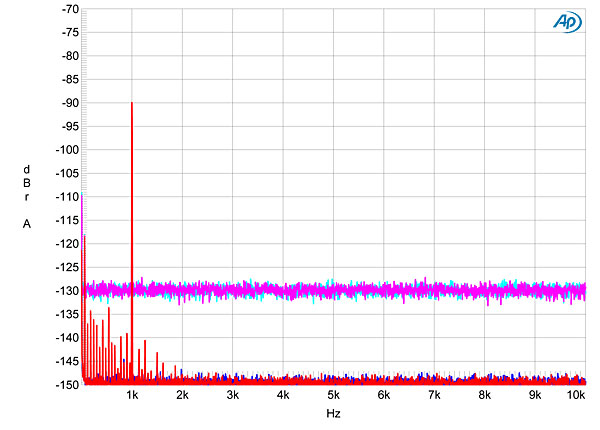
Fig.6 Peachtree iDac, Hi-Bit, FFT-derived spectrum with noise and spuriae of dithered 1kHz tone at –90dBFS, with: 16-bit data (left channel cyan, right magenta), 24-bit data (left blue, right red).
Linearity error with 16-bit data (fig.7) was dominated by the recorded dither noise. With undithered data at exactly –90.31dBFS and the NAL filter engaged (fig.8), the iDac's superb resolution and low noise floor make it easy to distinguish both the three DC voltage levels described by these data and the symmetrical Gibbs Phenomenon "ringing" on the waveform tops. Increasing the bit depth to 24 gives a superbly well-resolved sinewave (fig.9), despite the very low signal level.
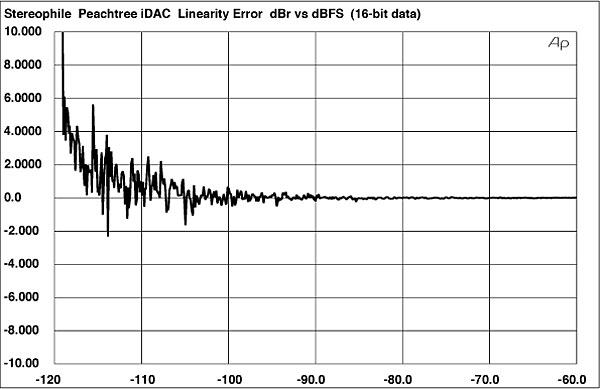
Fig.7 Peachtree iDac, linearity error with 16-bit data (2dB/vertical div.).
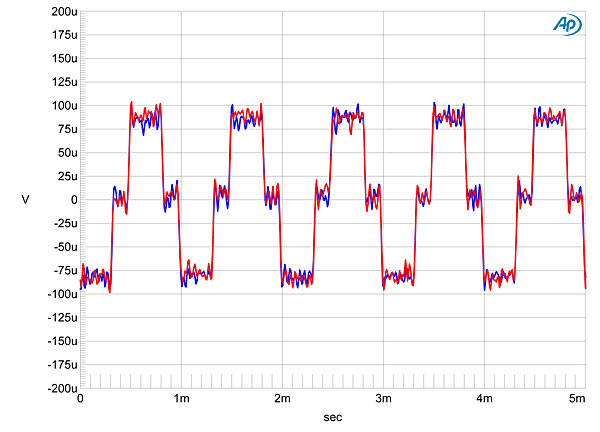
Fig.8 Peachtree iDac, NAL filter, waveform of undithered 1kHz sinewave at –90.31dBFS, 16-bit data (left channel blue, right red).
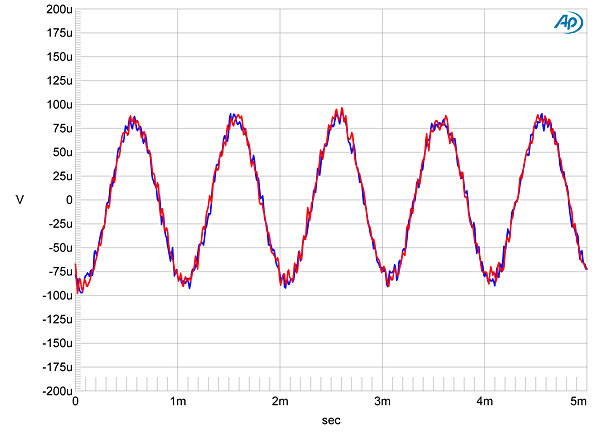
Fig.9 Peachtree iDac, NAL filter, waveform of undithered 1kHz sinewave at –90.31dBFS, 24-bit data (left channel blue, right red).
The iDac's output stage offered low levels of distortion, even for full-scale signals (fig.10). The second and third harmonics are almost equal in level, at a low –90dB (0.003%) each, and were hardly affected when the 100k ohm load was replaced by 600 ohms. However, a pair of sidebands is visible at 1kHz, ±290Hz. Though these are at a very low level, they shouldn't be there at all. They disappeared with lower-level data (not shown).
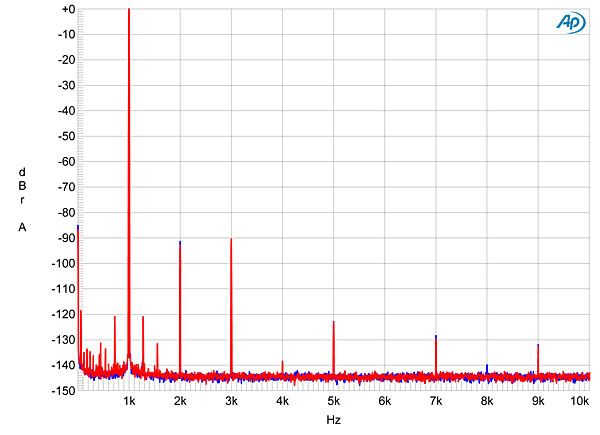
Fig.10 Peachtree iDac, spectrum of 1kHz sinewave, DC–1kHz, at 0dBFS into 100k ohms (left channel blue, right red; linear frequency scale).
With the NAL filter engaged, the iDac performed well with the high-frequency intermodulation test (fig.11). All intermodulation products lie at or below –100dB (0.001%), and the aliases of the 19 and 20kHz signals at 24.1 and 25.1kHz (with 44.1kHz data) are well suppressed. The picture changed with the NOS filter (fig.12). Not only are the aliasing products of the main signal now almost as high in level, due to the slow-rolloff filter, but the noise floor in the audioband is littered with intermodulation products. Ugh.
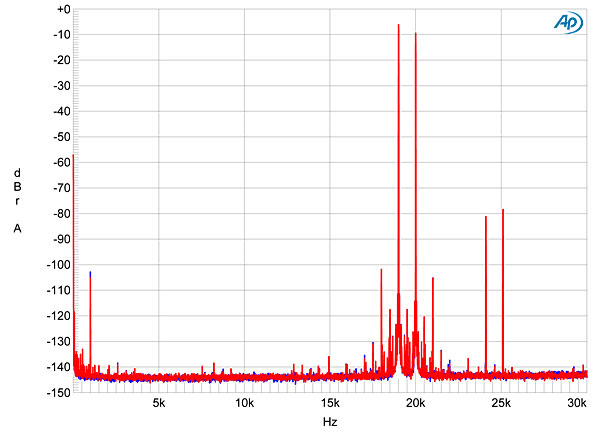
Fig.11 Peachtree iDac, NAL filter, HF intermodulation spectrum, DC–24kHz, 19+20kHz at 0dBFS into 100k ohms (left channel blue, right red; linear frequency scale).
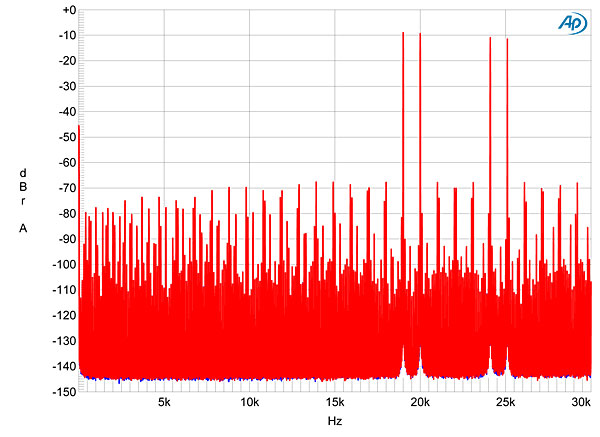
Fig.12 Peachtree iDac, NOS filter, HF intermodulation spectrum, DC–24kHz, 19+20kHz at 0dBFS into 100k ohms (left channel blue, right red; linear frequency scale).
The optical S/PDIF connection rejected more jitter than the coaxial. The blue and red traces in fig.13 show the spectrum with the iDac fed a 24-bit version of the J-Test signal via TosLink. Though no data-related sidebands can be seen, there are significant sidebands at ±73Hz, with lower-level pairs at ±290Hz (again) and ±900Hz; all these are both of unknown origin. Changing to 16-bit J-Test data (fig.13, cyan and magenta traces), the data-related sidebands are close to the residual level, other than the pair at ±229Hz. The Miller Analyzer calculated the jitter level as 470 picoseconds peak–peak.
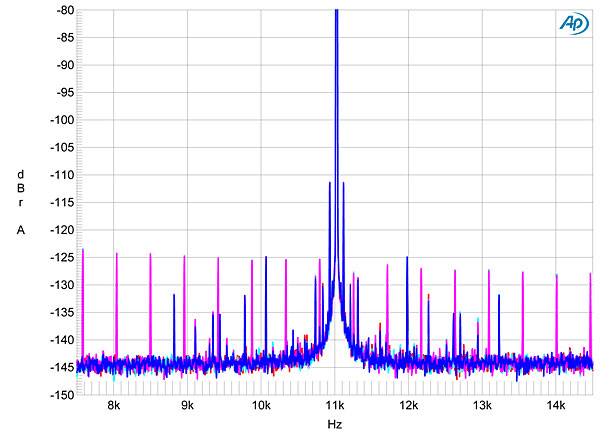
Fig.13 Peachtree iDac, high-resolution jitter spectrum of analog output signal, 11.025kHz at –6dBFS, sampled at 44.1kHz with LSB toggled at 229Hz: 16-bit data via 15' TosLink S/PDIF from AP SYS2722 (left channel cyan, right magenta), 24-bit data (left blue, right red). Center frequency of trace, 11.025kHz; frequency range, ±3.5kHz.
Repeating the test, but with the iDac now fed 16-bit data from my MacBook via USB, gave 119ps p–p of jitter (fig.14, cyan and magenta traces), with the data-related sidebands at the residual level. These disappeared with 24-bit data (blue and red traces), but a pair of sidebands can be seen at ±1kHz, this related to the USB polling interval, as well as some low-frequency sidebands. With 16-bit J-Test data played from my iPod Classic (fig.15), the measured jitter level was an extremely low 88ps p–p, though a sideband pair can be seen at ±3288Hz. The central peak that represents the 11.025kHz tone is also a little broadened compared with figs. 12 and 13, suggesting the presence of random low-frequency jitter.
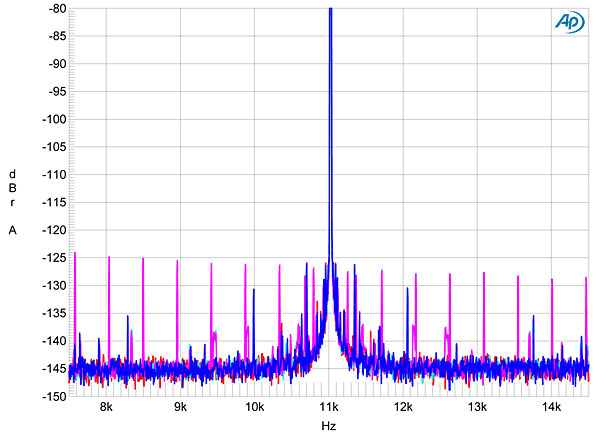
Fig.14 Peachtree iDac, high-resolution jitter spectrum of analog output signal, 11.025kHz at –6dBFS, sampled at 44.1kHz with LSB toggled at 229Hz: 16-bit data via USB from MacBook (left channel cyan, right magenta), 24-bit data (left blue, right red). Center frequency of trace, 11.025kHz; frequency range, ±3.5kHz.
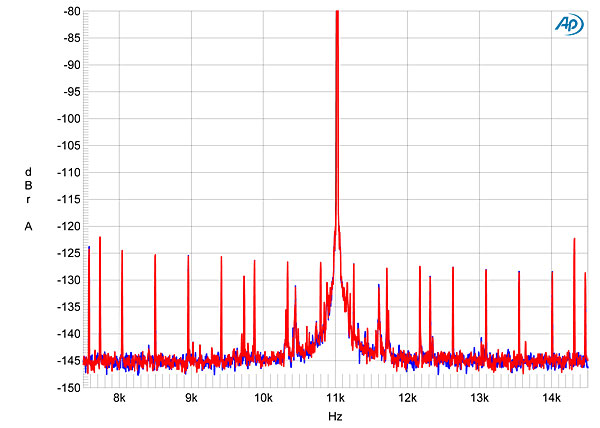
Fig.15 Peachtree iDac, high-resolution jitter spectrum of analog output signal, 11.025kHz at –6dBFS, sampled at 44.1kHz with LSB toggled at 229Hz: 16-bit data from iPod Classic (left channel blue, right red). Center frequency of trace, 11.025kHz; frequency range, ±3.5kHz.
The Peachtree iDac measures very well, especially considering its affordable price. As always, the use of a non-oversampling filter raises my eyebrows, but as the iDac also offers a conventional filter, this is not an issue. My only regret is that the iDac's USB input does not operate at 88.2kHz, but for such files one could always use something like Musical Fidelity's V-Link ($169) to feed one of the Peachtree's S/PDIF inputs.—John Atkinson
|
|
| ||||||||||
- Log in or register to post comments


| Loudspeakers Amplification Digital Sources | Analog Sources Accessories Featured | Music Columns Retired Columns | Show Reports | Features Latest News Community | Resources Subscriptions |
 © 2024 Stereophile
AVTech Media Americas Inc., USA
All rights reserved

