| Columns Retired Columns & Blogs |
NHT Evolution T6 loudspeaker system Loudspeaker Measurements
Sidebar 4: Loudspeaker Measurements
My estimate of the M6 satellite's sensitivity was to specification at 86dB(B)/2.83V/m. Its impedance plot (fig.13) featured the single bass peak typical of a sealed-box design, this placed at 66Hz, suggesting modest LF extension. Other than minor excursions below 6 ohms in the upper bass and the middle of the midrange, the M6's impedance suggests it is an easy load for an amplifier to drive. The graph is also free of the small wrinkles that would suggest the presence of cabinet resonances. While an investigation of the panels' vibrational behavior with an accelerometer found some resonant modes (fig.14), these were all low in level.

Fig.13 NHT Evolution M6, electrical impedance (solid) and phase (dashed). (2 ohms/vertical div.)
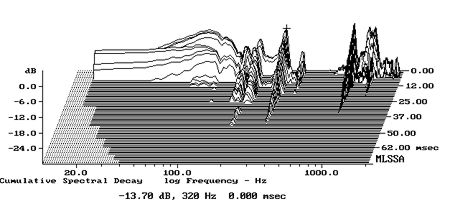
Fig.14 NHT Evolution M6, cumulative spectral-decay plot of accelerometer output fastened to center of top panel. (MLS driving voltage to speaker, 7.55V; measurement bandwidth, 2kHz.)
Moving to the frequency domain, the black trace in fig.15 shows the M6's farfield response on the tweeter axis averaged across a 30 degrees horizontal window and spliced at 300Hz to the complex sum of the nearfield woofer (red) and midrange (blue) responses. The crossover between the woofers and midrange appears to be set a little lower than the specified 400Hz, but with well-controlled rolloffs for the drive-units. The response is impressively flat overall, with small peaks and dips approximately equal in amplitude. The small rise in the upper bass is undoubtedly due to the nearfield measurement technique; the M6 is actually flat down to around 80Hz, with then a well-controlled second-order rolloff—ideal for integration with NHT's B6 subwoofer, even without the X1.

Fig.15 NHT Evolution M6, anechoic response on tweeter axis at 50", averaged across 30 degrees horizontal window and corrected for microphone response, with the complex sum of the nearfield midrange (blue) and woofer (red) responses, taking into account acoustic phase and distance from the nominal farfield point, plotted below 300Hz (black).
The M6's treble response is smooth. Other than the small on-axis peak centered just below 2kHz, the response in fig.15 doesn't suggest any reason for the occasional brightness I heard. However, the plot of the NHT's lateral dispersion (fig.16) suggests that the 2kHz peak is accentuated on the midrange side of the baffle (shown to the rear of fig.16) and exaggerated by the fact that the on-axis dip at 2.7kHz deepens on the tweeter side of the baffle. The lateral dispersion is quite different on the two sides; this is why optimal setup of a pair of M6es is a tricky business—you have to balance the on-axis response with the power response, which in turn will depend on the room acoustics and furnishings and whether you have the tweeters on the speakers' inside edges or not.
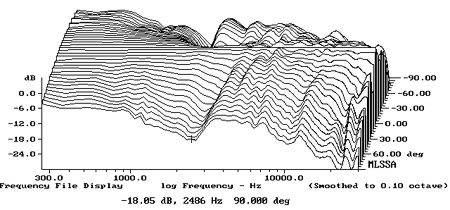
Fig.16 NHT Evolution M6, lateral response family at 50", normalized to response on tweeter axis, from back to front: differences in response 90–5 degrees off-axis on midrange side of baffle, reference response, differences in response 5–90 degrees off-axis on tweeter side of baffle.
In the vertical plane (fig.17), despite the twin woofers, the M6's radiation pattern is wide and even. The speaker is not going to be too fussy about listener height. Fig.18, a spatially averaged response taken in a window centered on the position of my ears, shows how all these quasi-anechoic responses added up in my listening room. The red trace is the M6es alone, the blue trace the complete T6 system with the B6 subwoofers and the X1 controls set by ear to sound flat. The treble and midrange are extraordinarily flat, though this extended a treble in-room suggests the tweeter level could be usefully reduced a dB or so to optimize the speaker's balance for conventionally sized rooms. This behavior, too, would have contributed to my finding the speaker to sound a bit top-heavy. Without the B6 subwoofers, the M6es roll off below the 80Hz band. With the B6es, the low frequencies are well extended, though I couldn't eliminate a lack of energy in the 50Hz and 63Hz bands, which is a characteristic of my room's acoustics.

Fig.17 NHT Evolution M6, vertical response family at 50", from back to front: differences in response 45–5 degrees above HF axis, reference response, differences in response 5–45 degrees below HF axis.
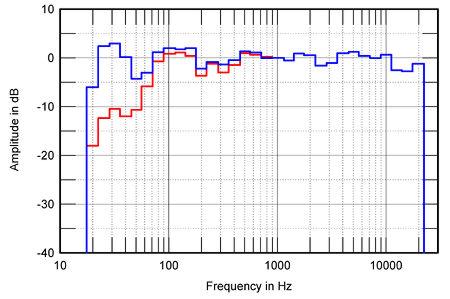
Fig.18 NHT Evolution T6, spatially averaged, 1/3-octave response in JA's listening room with (blue) and without (red) B6 subwoofers.
In the time domain, the M6's step response (fig.19) indicates that all four drive-units are connected in positive polarity. The speaker's cumulative spectral-decay plot (fig.20) is pretty clean in the treble, with only a small ridge of delayed energy apparent at the metal-dome tweeter's ultrasonic resonance frequency. The delayed energy apparent in the midrange—where this graph has limited resolution, unfortunately—may well be due to interference between the outputs of the lower-frequency drivers.

Fig.19 NHT Evolution M6, step response on tweeter axis at 50" (5ms time window, 30kHz bandwidth).

Fig.20 NHT Evolution M6, cumulative spectral-decay plot at 50" (0.15ms risetime).
Its measured behavior indicates that some excellent audio engineering has gone into the NHT Evolution T6's design. Despite its affordability, this system's performance has not been compromised to reach its attractive price.— John Atkinson
|
|
| ||||||||||
- Log in or register to post comments


| Loudspeakers Amplification Digital Sources | Analog Sources Accessories Featured | Music Columns Retired Columns | Show Reports | Features Latest News Community | Resources Subscriptions |
 © 2024 Stereophile
AVTech Media Americas Inc., USA
All rights reserved

