| Columns Retired Columns & Blogs |
NHT 3.3 loudspeaker Measurements
Sidebar 1: Measurements
John Atkinson performed the measurements on the NHT 3.3, handing me the file only after I had finished my auditioning. Its B-weighted sensitivity measured approximately 87dB/W/m (B-weighted). Its impedance (fig.1) is quite uniform, both in magnitude and phase angle, verifying NHT's specifications and indicating that the 3.3 will be a relatively easy load to drive. The maximum value of just over 10 ohms at 27Hz indicates the low-frequency tuning point of the system—an unusually low value. This is the -6dB point of the woofer's near-field response (see fig.2). The latter combines the complex sum of the nearfield responses of the lower and upper woofers with the quasi-anechoic response on the tweeter axis, averaged across a 30 degree horizontal window. The bass extension is excellent and will extend even deeper than this with room-boundary reinforcement, as is indicated from the in-room manufacturer's specifications. The dip across the upper bass may be at least partially the result of the difficulty of precisely summing the lower and upper woofers' nearfield response measurements. But at least a part of it may be real. Recall that, in the listening tests, I found the NHT's midbass region to be well balanced. The slight excess warmth typical of the Stereophile listening room was less evident than usual, possibly compensated for by a slight dip in the NHT's response through this region.

Fig.1 NHT 3.3, electrical impedance (solid) and phase (dashed). (2 ohms/vertical div.)

Fig.2 NHT 3.3, anechoic response on tweeter axis at 50", averaged across 30 degrees horizontal window and corrected for microphone response, with the complex sum of the nearfield responses, taking into account acoustic phase and distance from the nominal farfield point, plotted below 300Hz.
The overall response in fig.2 is relatively smooth, with a generally linear trend. The small peaks flanking 1kHz might explain the occasional forwardness noted in the sound. Though they are fairly innocuous on an absolute basis, they may stand out slightly because the remainder of the 400Hz-4kHz band is very flat. Above 4kHz are visible several small peaks and dips which may relate to the tweeter crossover and the above-band response of the upper-midrange driver.
Aside from the tweeter resonance at 27.7kHz, the only remaining prominent feature is the peak in the response at about 9.5kHz, which persisted on all measurement axes. This peak is very narrow, covering only about 3kHz, or roughly half an octave, at this frequency. It should be audible, but not unduly so, and not on all recordings. It may explain the occasional but not persistent touch of brightness or glare from the 3.3, which varied with the program material. The general response trend in the treble, however, is reasonably linear.
Fig.3 shows the FFT nearfield responses of the two woofers and the midrange. The effective, acoustical high-pass slopes of both the upper woofer and midrange are approximately 24dB/octave. (The acoustical order of a crossover network is frequently different from its electrical response, which in this case is specified as second-order, or 12dB/octave.)

Fig.3 NHT 3.3, nearfield responses of midrange unit and woofers, scaled in the ratio of the radiating diameters.
The lateral response family of the 3.3, with any on-axis response deviations subtracted so that the on-axis response appears as flat, is shown in fig.4 with the response changes toward the inside edge of the baffle (toward the center of a stereo pair) shown to the front of this graph. Toward the inside, the top-end response is well maintained to 15 degrees off-axis, rolling off more rapidly as one approaches, then exceeds, 30 degrees. Toward the outside, where a small absorption block is placed to the side of the tweeter, the rolloff is much more rapid, with some mid-treble peakiness developing off-axis.

Fig.4 NHT 3.3, lateral response family at 45", normalized to response on tweeter axis, from back to front: differences in response 90 degrees-5 degrees off-axis on outside edge of baffle, reference response, differences in response 5 degrees-90 degrees off-axis on inside edge of baffle.
The vertical-response family is plotted in fig.5. Again, the responses are normalized to the on-axis response which therefore appears flat; only the changes resulting from moving off-axis are shown. The response just above the tweeter axis shows small peaks in the mid-treble which are the approximate inverse of the dips evident in the same region in fig.2. This suggests that these dips will fill in as the listener moves up level with the midrange. However, though the optimum listening height appears to be slightly above the tweeter, vertical positioning is relatively noncritical—as long as ear-height falls somewhere between the upper woofer and the midrange drivers. Unusually low or high listening axes, however, will result in a severe crossover suckout in the mid-treble.

Fig.5 NHT 3.3, vertical response family at 45", normalized to response on tweeter axis, from back to front: differences in response 20 degrees-5 degrees above axis, reference response, differences in response 5 degrees-10 degrees below axis.
The impulse response on the tweeter axis is shown in fig.6. Some ultrasonic ringing is visible, but is no worse than is typical with a metal-dome tweeter. Fig.7 shows the step response, calculated from the impulse response data in fig.6. The step response is the output of a loudspeaker presented with a sudden DC voltage at its input. Ideally, the step response should resemble a triangle with an initial perpendicular rise from the time axis, then an almost straight-sloped return to that axis. A loudspeaker is essentially a high-pass filter which will respond to the initial displacement of a DC input, but, as it is unable to reproduce DC, cannot maintain the step. (For more on this test, see JA's review of the Vandersteen 3 in Vol.16 No.3, p.150.) The impulse response of the overall system in fig.7 and the nearfield impulse responses of individual drivers (the latter not shown) indicate that the two woofers are connected in positive polarity and the midrange and tweeter in negative polarity. The same result is evident from fig.7, with the two negative-going excursions indicating the contributions of the tweeter and midrange respectively. (The contributions of the woofers are too low in relative level to show on this graph.)

Fig.6 NHT 3.3, impulse response on tweeter axis at 45" (5ms time window, 30kHz bandwidth).

Fig.7 NHT 3.3, step response on tweeter axis at 45" (5ms time window, 30kHz bandwidth).
The cumulative spectral-decay, or "waterfall," plot is shown in fig.8. Note that the peak just under 10kHz has a small resonant ridge associated with it, and there is also a bit more hangover around the small rise at 5.6kHz than in the areas just below and above. There is a small degree of hash in the decay performance around this frequency and above 10kHz, but its level is low. The ridge at the far right is the ultrasonic tweeter resonance, which, at 27.7kHz, is well above the audible range. Despite the 3.3's large panel areas, its enclosure seems well-damped. Using a simple PVDF accelerometer to examine the vibrational behavior of the cabinet walls revealed only slight resonant modes at 309 and 389Hz. Fig.9, for example, is the waterfall plot calculated from the accelerometer's output when fastened to the inner side wall about 6" from the top. Other than a slight degree of motion at the woofer's tuning frequency of 27Hz, just a mild mode at 389Hz can be seen.
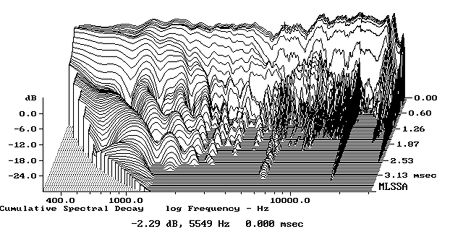
Fig.8 NHT 3.3, cumulative spectral-decay plot at 45" (0.15ms risetime).

Fig.9 NHT 3.3, cumulative spectral-decay plot calculated from the output of an accelerometer fastened to the top center of the woofer side panel (MLS driving voltage to speaker, 7.55V; measurement bandwidth, 2kHz).
Finally, I ran the Listening Environment Diagnostic Recording (LEDR) from the first Chesky Test CD (JD37). This test uses a specially generated signal to help in the subjective evaluation of the imaging from a stereo pair of loudspeakers in a room. The lateral image here was excellent on the 3.3s, with a smooth transition from left to right and back. The "Up" and "Up and Over" tests were a bit less successful, the sensation of height sounding a little vague.—Thomas J. Norton
- Log in or register to post comments
